Pages

Sunday 23 August 2015

Doris - simulation, storage and sustainability (5) - Good and Bad Years

Doris is a computer simulation of household energy consumption designed to explore the relationship between storage and the consumption of energy from sustainable sources.  It exists only in the imagination and has no physical reality.  A description can be found here:
This page also has links to related posts.

Wind and solar powered generators are weather dependent systems, the data feed for Doris is weather reports, these are in real time on the Pi and historic on the laptop.  Climate is what you expect and weather is what you get.  In the UK our weather is influenced in turn by the land mass of continental Europe and the water mass of the Atlantic Ocean from which come a procession of depressions.  The result is a moderate, but varying climate.  The yield from Agriculture is in part influenced by the weather, for example in the period 2010 to 2014, the UK wheat harvest varied from approx. 12 to 16 million tons.

When I first became interested in sustainable energy, I started to seek out data on wind speed and solar irradiance and cycle around the town and local countryside with a wind speed meter, these exercises were undeniably instructive.  About the same time, I saw my house on Google Earth and became ashamed of the state of the garden.  I cleared the weeds, made an attempt to improve the flower beds and created a small vegetable garden.  This provides a small supply of misshaped vegetables of a quality that supermarkets refuse to stock .  It also taught me the relationship between sunshine and plant growth.  Beetroot grown in the partially shaded front garden are sad, weedy things, whilst those grown at the back in full sun are big enough to cook and eat, even though they are smaller than the imports from Spain and Egypt.  The seasons that shape a garden, also determine the output of wind and solar energy systems.  Solar panels have good and bad years, just like the harvests.

A useful piece of advice from a manager on whom I was inflicted, was "first make the code work, then make it work quickly".  Doris is still in the first stage and does not run quickly, so it had only worked through five years of data before I had to move on, ideally, you would need a much bigger sample to get an understanding of year-on-year variations, so this graph which shows the %age of energy taken from conventional sources only shows that there is year-on-year variation.


Some of the variation is due to variations in wind speed as shown in the graph below.  I have memories of the summer of 2013 as being sunnier than usual and this is reflected in the low dependency on conventional sources because of the increased output from solar panels under a clear sky.

Doris is intended to explore the response of a system which attempts to minimize dependency on conventional energy sources.  The output of coal and gas power stations can be varied to meed demand whilst that of sustainable systems is dependent on the weather.  In the 19th century, sailing ships started to be displaced by steam driven ones because they were more reliable.  The design of sustainable system need to be aware that the supply may be constrained.


Wednesday 19 August 2015

Doris - Simulation, storage and sustainability (4) - You have to do both

Doris is a computer simulation of household energy consumption designed to explore the relationship between storage and the consumption of energy from sustainable sources.  It exists only in the imagination and has no physical reality.  A description can be found here:
This page also has links to related posts.

The current version of Doris is the third attempt to explore a sustainable energy system.  The first took place in 2007/8 which became known as the Solar Bucket.  This was simply a 4 watt solar panel connected to a small lead acid battery, during the day the panel charged the battery which was then used to support some form of load overnight, the most useful being an LED light.  The Solar Bucket worked OK during summer and less well during winter.  One of the lessons of this exercise was the effect of clouds on solar devices.  The second attempt was in 2013 which used the output of an imaginary wind farm to charge a bank of Ni-MH cells, if the make believe wind farm did not produced enough electricity, it kept itself alive using an old mobile phone charger.  This version ran erratically during the winter of 2013 and again in the spring of 2014.  The behavior of this system can be summarized as alternating between a few days on wind power and a few days hanging on the phone charger.

I took away two lessons from this experience, first that messing with hardware is a fun, but a slow way to explore a concept and a software emulation would be more efficient (and cheaper).  Secondly, for the location where I live which has a temperate maritime climate (Koppen type Cfb), a system which attempted to minimize dependency on conventional sources would probably need to utilize both wind and solar sources.

The graphs below show the result of three runs of Doris using historic data for 2011 using the base configuration with 10 kwh of storage and an annual load of 2,500 kwh.  In the first, the system has access to both wind and solar sources.  In its current form, Doris gives priority to solar energy, so the combined graph is biased towards solar and a different set of rules would give a different outcome, but it gives an indication of the direction of travel.

In this configuration, the peak demand for conventionally generated electricity is approximately 30% which can take place more or less anytime except summer.  When access is restricted to wind energy alone, the peak demand for conventional energy rises to 55% in summer with significant amounts being needed throughout the year.

In the solar only configuration, the dependency on conventional sources rises to 90% in winter, but less than 10% in summer.


As with all simulations, the output reflect decisions about the inputs.  for example, different results could be obtained by increasing the access to solar energy.  This would provide a surplus for export during the summer months with less dependency on conventional sources in winter.  The base configuration for Doris is loosely based on a 1 kw solar array (four 250 watt panels) and 1 kw of wind generating capacity.  The location of the wind capacity is assumed to be at a prime location.

History: originally posted on 19-Aug-2015 and revised 24-Nov-2015.

Images: blog_116


Monday 17 August 2015

Doris - Simulation, storage and sustainability (3) - Storage Sensitivity

Doris is a computer simulation of household energy consumption designed to explore the relationship between storage and the consumption of energy from sustainable sources.  It exists only in the imagination and has no physical reality.  A description can be found here:
This page also has links to related posts.

The base configuration for Doris is a household which consumes 2,500 kwh/year.  It is connected to the grid and has access to electricity from conventional, wind and solar sources.  In the base configuration (config 3) there is 10 kwh of storage.  Follow the above link for a more detailed description.  Incorporating storage into the household energy economy makes it possible to get a better match between the availability of electricity from weather dependent sources and the regular pattern of demand which comes from sleeping, work, college and preparing meals.

The proportion of sustainable energy consumed by a household from the grid is roughly 10 - 15% but on any given day this might vary from zero to 20% depending on the season and the prevailing weather. If a household has an element of storage, this might increase to 50 - 70%.  The Doris model assumes that the household has direct access to wind and solar sources, thus the output is not comparable to data from the national grid.

Obviously the the greater the amount of storage the better, but there are also economic constraints and this series of runs was intended to see where the law or diminishing returns set in with the objective of defining the base configuration.  As with any simulation, the output is determined by the assumptions used in the model and as there are many combinations, the graphs below only indicate the direction of travel rather than precise forecasts.

 The rules used by the Python 2.7 code give precedence to solar sources, if no solar generated electricity is available it then checks to see if there is any which has come from a wind farm, if insufficient power is available, the demand is met from storage and when this is exhausted if falls back on conventional sources from the grid.  Any surplus sustainable energy is used to recharge the storage.

The storage capacity affects the consumption of wind and solar sources differently.  The availability of solar sources is based on a 24 hour cycle with significant variations resulting from sun-earth geometry and cloud cover, thus diminishing returns set in with around 5 kwh of storage.  Wind energy tends to come in pulses a few days apart and the consumption of wind generated electricity increases with increasing storage.

The graph below shows that the proportion of energy from conventional sources falling as the storage capacity increaes.

Bases on these runs, the storage capacity for the base configuration was arbitrarily set at 10 kwh.  This is thought be a reasonable balance between cost and performance and there are available products for this capacity.

Note

This is a simulation, not real life.  This post was originally published on 17-Aug-2015 and substantially revised on 23-Nov-2015.


Friday 14 August 2015

Doris - A thought experiment in progress (2) - Energy Delivery

Doris is a computer simulation designed to explore the use of sustainable energy by a typical household.

The post which describes the background to the project, also contains links to related posts.
The core functionality of Doris is the facility to make estimates of the output of wind and solar generators using aviation weather reports (Metars).  The version running on the Raspberry Pi runs the base configuration and uses a live feed from NOAA, but the same code can be fed with historic data which makes it possible to explore a range of configurations and scenarios.

Wind and solar sources are weather dependent energy sources subject to seasonal variation, this distinguishes them from fossil/nuclear plant whose output is controllable.  Storage and diversity helps to match supply and demand.

The first graph shows the estimated breakdown of energy sources for a configuration with approximately one day's storage.  There are several things happening in this graph, the first is the seasonality of wind and solar sources.  Solar works well during the summer months, but makes little contribution during the winter.  Another issue is the constraints on the amount of energy that the system can import, these have been set at low levels and may restrict the amount of energy that can be stored.  During the winter months, the system falls back on to the grid more than is desirable. This is partly due to the differences in the pattern of delivery from wind and solar sources.


Wind energy comes in pulses at intervals ranging from a couple of days to a fortnight.  In winter during the calm periods, Doris maintains it's imaginary load from the grid.
In contrast the delivery of solar energy is regular, within a given month the greatest variation comes from variations in the nature of the cloud cover.
A relatively small amount of storage will provide a reasonable match between supply of solar energy during the summer and the load it is maintaining.  It is probable that a much larger storage capacity is needed to meet a constant load from wind sources.

The next step is to run a sensitivity analysis on the amount of energy taken from the grid and the storage capacity of the system.

Thursday 13 August 2015

Doris - A thought experiment in progress (1) - Background

Doris is a computer simulation designed to explore the use of sustainable energy by a typical household.

Doris lives in a simplistic and imaginary world, it poles weather reports from a randomly selected airfield which is near an imaginary wind farm. it has access to some fictitious local solar panels and thinks it is connected to the national grid. The meteorological data is used to estimate the wind and solar power that might be available. There is some storage built into the system and when more energy is available than is required to meet the load, it used to charge batteries. When the wind does not blow and the sun does not shine, the load is supplied from stored energy and when that is consumed it falls back on conventional sources from the national grid.  Energy from the wind farm is supplied from the grid whilst it is assumed that the solar panels are located on the consumer's site or on a local grid.

Doris - What is being simulated
It is the result of two activities:
  • Having spent much of life in the oil and gas industry, I felt the need to explore sustainable sources.  This included the academic study of things like wind speed distributions, climate, sun-earth geometry and the effect of clouds on solar irradiance.  There was also a practical element which included a 4.5 watt PV panel, a lead acid battery and an LED light known as the Solar Bucket plus a few cycle rides around the town and surrounding countryside with a simple wind speed meter.
  • In 2007, before the financial crisis, rooftop PV panels and wind turbines were becoming available and I became curious to to know if it was possible to economically reduce household reliance on the grid by using these products.
Both of these efforts came to the same conclusion, that increasing the proportion of household energy coming from sustainable sources was a challenge.  Some caveats are necessary before making any conclusions:
  • Economics are important, any alternative to fossil fuels must deliver the same benefits for a comparable cost, if it does not, no one will adopt it.
  • The technology is the key technology because it separates production and consumption into two separate processes.
  • Much discussion of sustainability focuses on generation, yet managing and reducing consumption is, maybe, more important.  Sustainability is easier to attain if the demand is low.
  • The nature of a sustainable solution is dependent on the climate in which it is installed, thus the experience of one country may not be relevant to another.  Solar PV might work well in the deserts of Arizona, but less so in the highlands of Scotland where wind turbines are a more attractive option.
The conclusions I came to for a location in the south of England were:
  • Solar PV works well in summer, but not in winter.  On a sunny summer day, the cumulative GHI might be 8 kwh/m2, whilst on an overcast December day it can be less 1 kwh and that is the time of year is when energy consumption is at a peak.
  • The most effective way of generating energy from the wind is from industrial scale wind turbines located in optimum locations such as onshore ridges and offshore.
  • Both solar and wind are discontinuous sources of energy, the sun does not shine at night and wind energy comes in pulses which can be several days apart.
  • Wind and solar sources will not be able to fully displace fossil fuels in the short term but the proportion from sustainable sources can be increased.
A system which could mitigate some of these issues for a typical household might look like this:
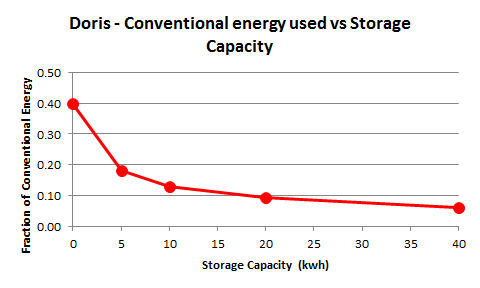
  • Focus energy consumption and management on storage with a capacity of 5 - 10 kwh.
  • Only draw energy from the grid when equivalent amounts of energy from sustainable sources are being fed into it.
  • Ensure that there is access to both wind and solar generating capacity.
  • Use energy generated from conventional sources only when the storage is depleted and sustainable source are not available.
Such a scheme might increase the proportion of sustainable energy consumed by a typical house to around 70%.

Doris is software which can be modified to explore ideas without the expense which would be incurred by working with expensive real things.  Several configurations and scenarios have been run and these are described in the following posts:
Simulation is not real life, so the results should be treated as a possible direction of travel rather than detailed predictions.  At the time of writing, these posts are being edited and are subject to change.

Doris can runs in two modes:
  •  On a Raspberry Pi with live data from NOAA via an internet connection.  The Pi runs the base configuration and is capable of uploading graphics to a shared server.  In this case, the behavior of the software has some relation to the weather on the other side of the window.
  • Much the same code runs on a laptop using historic data from an SqLite database, this allows different scenarios to be run against the same weather data or similar configurations with different weather data.
   The data flow looks like this:

Doris - Data flow
Doris is work-in-progress. The first iteration used an old laptop, an interface card and a home brewed bank of Ni-MH cells, the computer obtained weather data from the internet and made decisions which it implemented using the interface card and tried to maintain a small load without recourse to the grid (in reality a discarded mobile phone charger). Whilst this was both entertaining and instructive, it was an inefficient way of exploring the concept, not least because of the energy overhead of the aging laptop and the risks associated with my dubious knowledge of power electronics.

Doris - The first attempt, a second would be nicer
Whilst there are significant technical and commercial issues associated with implementing a "real" version of Doris, it is economics which presents the greatest challenge.  Whilst the virtual world of Doris has the potential to reduce emissions by maximizing the use of energy from sustainable sources, the economics don't look good. The retail consumer has two pricing options, either a single tariff or something like Economy 7 which offers electricity for around 7 p/kwh in the wee small hours and at least twice that during the day. Solar generated electricity is almost by definition can't be bought off peak because the sun does not shine at night. For this scheme to be viable there needs to be some innovation in the energy market which gives producers are reasonable rate of return and reduces the reliance on fossil/nuclear sources. One possibility is for users to have a stake in the ownership of  generating capacity rather than buying its output at a unit cost.

The base configuration of Doris was chosen such that the installed cost of a non-imaginary system would be within sight of £5k, this is summarized as:
  • Annual energy consumption: 2,500 kwh (approx. 7 kwh/day)
  • Storage capacity: 10 kwh
  • Solar generating capacity: 1 kw
  • Wind generating capacity 1 kw
The methodology for estimating solar irradiance under a cloud sky is evolving and is part of a separate project, the method used for Doris has a pragmatic element to it and hopefully will evolve.

Some of the work from which Doris originated is described in these posts:
Who was Doris?

I first heard the expression "I'm Doris, the goddess of wind" from an old bloke I worked with in a sheet metal factory.  There's a lot of wit in factories along the lines of "The water is safe to drink because it's been passed by the management".  The Doris quip stayed with me and then someone invented the internet and Jimmy Wales started Wikipedia.  This tells me that it was the catch phrase of Douglas Byng who is described as an English comic who trod the boards before and after the second world war.  As many software titles get subverted, it seemed a good idea to start with something that was already ambiguous.

This post was revised on 03-Nov-2015