Pages

Friday 16 August 2013

Urban Wind

Munn's third law states that any place you can wear a kilt or a skirt without embarrassment might not be a great place to put a wind turbine.  With this in mind, I spent a few mornings cycling round a seaside town with a simple wind speed meter in an attempt to get an understanding of urban wind.

Until recently the most common source of wind speed data was weather reports from airfields. These are large open spaces and the weather station is usually located somewhere close to the point of touchdown where its data will make the greatest contribution to aircraft safety.  This is in contrast to most residential and commercial areas which are cluttered with buildings, trees and infrastructure such a bridges all of which might be crammed into hillsides and valleys. In the past few years, data from small weather stations mounted in backyards has become available.  The two sources give different impressions, typically, airfields have a average annual wind speed in roughly in the range 4 - 7 m/s, whilst backyards might experience 1 - 4 m/s.  As with all gross generalisations, there are exceptions, but my own backyard sitting on the sheltered side probably has an average of around 1 m/s based on many calm days and a few gusty ones.

Wind speed measurements are typically taken at a standard height of 10m although there are some important exceptions, for offshore buoys it is often 4 - 5 m, for offshore platforms it can be well over 100m (to assist helicopter operations).  Private weather stations can be at any height available to the owner. However, they are generally located at the base of the boundary layer which is not an ideal place to put a wind turbine.  Utility scale machines are mounted on towers, typically 100 metre tall which lift the rotor out of the turbulent and complex air flows found around roof and tree tops.  The photo shows a medium sized wind turbine mounted on a tall tower in an urban location:


However, this type of structure is not practical/acceptable in the average backyard, so wind found at approximately 10 metres is the the resource that is available to most people (subject to neighbours, town planning and building regulations which keep towns and cities safe and relations between residents harmonious).

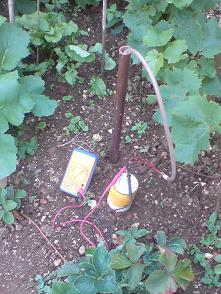
The plan was to cycle around the town taking wind speed measurements at a variety of locations and compare them to data from a small airfield a few km to the west.  In a failed attempt to introduce an element of street theatre I took a small model of a Savonius wind turbine with me.


Whatever other merits it may possess, the Savonius design can withstand the rough handling that comes from being strapped to the back of a bike.

During seven outings I found about 20 locations where I could take measurements.  With the single exception of a curious dog, this bizarre activity attracted no attention.  The locations included the seafront and a breakwater, the roofs of multi-story car parks and my own backyard.  One days results are shown in graphic form below:

Moderate winds at the airfield are usually smooth and there is a good relationship between the wind there and that experienced on the sea front.  In these places the Savonius model would spin continuously when the wind was greater than 3 m/s.  However, in the town, suburbs and parks the wind was usually attenuated and turbulent, the graphic is a sketch of the relationship between "clear" and "urban" wind:

The rooves of car parks were the most interesting, all five locations were well above surrounding roof tops, yet in all cases, the wind was turbulent and it was rare for the Savonius model to spin continuously.  Having seen several horizontal axis wind turbines in urban locations they often appear to "hunt" for the wind then spin up and down with the gusts.  The vertical axis Savonius was usually quick to respond to gusts, however, the coefficient of performance is low.  The coefficient of performance is the fraction of the wind's energy that the turbine manages to extract.

The relationship between wind speed and power is cubic, thus a 5 m/s wind has almost five times the energy of one of 3 m/s, the relationship is complicated by variations in a turbine's coefficient to performance with wind speed.  In general, the coefficient of performance declines with increasing turbulence.

It is probable that a suburban area with low and widely spaced housing on flat land might give more encouraging results, but in a densely populated English town, small wind turbines have limited potential for generating significant amounts of energy.  The greatest potential for wind energy appears to be large turbines located offshore where average annual wind speeds are significantly higher than those onshore.  However, offshore wind is still a weather/climate dependent energy source.


Friday 9 August 2013

Negawatts vs, Megawatts

There are two ways to reduce emissions and increase energy  security.  The first is to use less energy and the second is to generate it from renewable sources.  The two approaches are not mutually exclusive and both are desirable but they compete for resources.  Around 2006, I became interested in renewable energy, up to that point, I had not thought too much about consumption and at that time electricity was reasonably priced.  Typical grid-tied, rooftop PV installations produce between 1,500 and 2,500 kwh/year.  A good starting point was to try reduce our consumption to the level at which a form of self-sufficiency could be attained.

Alongside my interest in renewable energy, is a belief that investments which are good for the environment, should also be good for me.  Added to this is the belief that sound investments are based on fundamentals (e.g. fuel savings) and should not be driven by tax regimes or subsidies, In other words, I'm prepared to buy an item which reduces my emissions, but I want to be rewarded in the form of lower energy bills.  For energy consumption, and therefore emissions to fall, there should be a "virtuous circle" by which I use less energy and I am better off as a result.  This should be possible to achieve, energy is now expensive.

Whilst I am fascinated by solar devices and wind turbines, conservation was consistent with my opinions (my favourite coffee mug has the slogan - "everyone's entitled to my opinions").  The graph below shows our household's estimated electricity consumption since 2005:


When we started there were some quick wins, incandescent lamps were replaced by CFLs and old computers which were better room heaters than number crunchers were replaced by laptops.  The gas driven domestic hot water system was an economic mess consisting of a gravity feed system with an efficiency of 20% (a charitable estimate).  This took an average to two hours to create a warm bath, therefore anyone needing to be clean used the immersion heater (cheap at night, but expensive during the day).  The water heating was upgraded to a pumped system which also reduced the gas bill and did not leak.  Rough estimates of the breakdown of consumption "before" and "after" are shown below.


Since 2007, consumption has drifted down to an average of 6 kwh/day, mainly as a result of taking account of energy efficiency as things like fridge have had to be replaced and just being aware of our energy consumption.  We are not wandering around in Stygian darkness obsessed by energy bill dropping through the letterbox.

The law of diminishing returns is beginning to assert itself, we are starting to replace CFL lamps with LED ones which may take us down to 4 kwh/day over the next one or two years.  Our electricity consumption will probably be in the range 1,000 to 1,500 kwh/year, which compares well with the national average of around 3,500 kwh/year (comparing averages is always dangerous).

It has to be said that a wind turbine in the back yard would be fun but as I have embarrassed myself on countless occasions by wandering around the garden with a wind speed meter consistently reading 0 m/s and have no desire to annoy my neighbors, this is not going to happen.  The sun does not shine at night and rarely during winter, so rooftop PV does not appeal.  So, I will press on with the LED lights.

Sadly, conservation is not sexy.  Acquaintances with rooftop PV who have seen me cycling around with a model wind turbine strapped to my back ask me why my south facing roof is empty and an unscientific survey of the environmental pages of the papers (read on my phone) suggests that greater coverage is given to wind farms than to things lurking in cupboards like boilers, heating controls and meters.  A knowledge of the capabilities of smartphones is a sign of virility whilst being able to read gas and electricity meters is considered boring.  Typically, a mobile phone bill is in the range £15 - £30/month, whilst energy bills often exceed £100/month, so there is an incentive to take an interest.

The scale of investment is also an issue, I have the occasional outing to an "eco" fair where a high proportion of the offerings are green boxes with a price tags well over £1,000.  This is not the sort of money that fits well into a typical family budget, yet £10 for an LED light or a few quid extra for a more efficient fridge or washing machine can make a difference over time.

Policies which focus on conservation are difficult for politicians, offering subsidies for generation projects gives an incentive to do something.  Telling people not to do something, i.e. use energy is creates a range of reactions ranging from indifference to to charges of infringing of civil liberties:.


Its better to make a good case for energy efficient lighting than embarking on legislation which does not win hearts and minds.  Had we not adopted CFL's are electricity bill would now be approaching £100/month.

The link between environmental benefits and high cost objects also seems to be well established in (some) political thought processes.  During the 2010 election I was accosted by a canvasser keen to establish the environmental credentials of their chosen candidate, in the interests of fairness, it is probable that I was being a pain at the time, but the patter went along the lines "Of course she can't afford a Hybrid Car". My understanding of hybrid vehicles is that by combining a petrol/diesel engine, motor/generator and a battery you can make a fairly efficient vehicle for £27,000, however, some conventional vehicles, often described as "dull" by reviewers, offer similar performance for much less.  Other options include a small car, no car and a bicycle.  If you live in a remote rural area, you need a car, if you live in a city, a bicycle makes sense economically and environmentally, that also seems to be the view of the current Mayor of London, the man behind the Boris Bike.

Next week - Urban Wind


Friday 2 August 2013

Soil Temperature

Last year, I became curious to know why there was such a wide variation in the time to germination of seeds (mainly beetroot).  Sowing things at the earliest date suggested by the directions on the packet seemed like a good way to maximise yields, however, some seeds took a month to germinate with a low success rate, whilst the same variety planted in late July germinated quickly with a high success rate.  One explanation was variation in soil temperature, even in England, the ground is warmer in July than it is in March.  To try and understand what was happening, I started measuring soil temperatures approximately an hour before sunset on Sunday evenings.  This post is a celebration of a year's data collection and the politeness of my neighbours.

This web page is periodically updated with data as it becomes available:

Brighton Webs - Soil Temperature

The first step was to sink a length of copper pipe into the ground, the only consideration about its location was the hope that the house's water supply was located somewhere else.  The base of the pipe extends a few centimetres into the chalk which is the dominant feature of the landscape in these parts.


Temperature measurements are taken by lowering a 4.7k thermistor mounted on the end of a 2 metre length of neoprene tubing.  A baffle on the end of the tube is meant to limit the movement of air in the hole to ensure that the measurement is related to the pipe, not the air within it.  The resistance of the thermistor is taken with a basic and much abused multimeter.


The photo shows the equipment in use, data logging is done with a pencil and paper.

The results to date are plotted on the graph below together with the average air temperature for Brighton.

The graph clearly shows the wide variations in temperature experienced by the topsoil.  In winter radiative cooling on a clear night can take the topsoil temperature several degrees below the air temperature whilst a hot sunny day with a clear sky can raise it several degrees above it.  The thermal environment of vegetables is much more turbulent than one would suppose from simply looking at the air temperature from a weather report.  Some gardeners will have experienced the damage done by overnight frost and discovered this on a warm spring morning.

In contrast to the topsoil, the subsoil temperature closely follows the average air temperature.  The relationship between the topsoil and subsoil temperatures is interesting, when the ground is cooling after the Summer Solstice, the subsoil is warmer than the topsoil.  After the winter solstice, the subsoil takes a few weeks to start warming.  It is as though the subsoil is acting like a storage heater, keeping the soil warm as Autumn and Winter approach.  I was intrigued by this, the graph below shows a simulation of the solar irradiance received by the earth's surface and the average air temperature.  Solar irradiance peaks at the Summer Solstice in June and is at a minimum at the Winter Solstice in December, yet the warmest month is July and the coldest one is January
Whilst solar insolation and radiative cooling account for a large part of the temperature variation experienced by the topsoil, advection is also significant.  From January to April 2012, cold air masses moved across the Channel from Continental Europe, these acted to suppress the soil temperate, making it difficult for seeds to germinate, it was May before the topsoil temperature got above 10 deg. C.

Climate classification schemes as Koppen are based on the concept that native plants have adapted to the prevailing temperature and rainfall.  In 1954 Dorothy Hartley published "Food in England", this was before the worldwide movement of fruit and vegetables.  In the 1950s, market gardens could found on the edges of big town, also many people had been involved in part time vegetable cultivation during the war and had continued to do so in their back gardens.  Some of the varieties described by Harley had been bought to England form overseas, the best known example being the potato which is thought to have originated some around Peru or Bolivia, but all of them had been grown here for at least a hundred years.  A common characteristic of most of the plants grown from seed is that they will germinate in temperatures of less than 10 deg. C..