Pages

Saturday 31 October 2015

Historic Windmill Sites

When I first became interested in sustainable energy it seemed that it was a data-rich industry, whilst good quality meteorological data is available in long time series, a lot of it comes from aerodromes which are flat, unobstructed spaces.  Solar devices are relatively independent of terrain, however, the output of wind turbines is determined by terrain.  Within a few kilometers of where I live, the wind speed can vary between 0 and 10 m/s according to location, where the terrain ranges from seafront, urban areas, exposed ridges and sheltered valleys.  Whilst industrial scale wind turbines for electricity generation are a relatively recent development, the wind was a significant source of energy in the 19th Century for milling and pumping applications.  There were approximately 20 windmill sites within what is now the Brighton and Hove city limits with several more within a few kilometers.  It is interesting to look at the location of these mills in the context of terrain.

The graphic below was mainly compiled from two sources:
  • Timothy Carder's excellent "The Encyclopedia of Brighton" which was published in 1990 by East Sussex County Libraries.
  • SRTM 1 arc second elevation data.  The 1 arc second data became available in 2014, prior to that only 3 arc second data was available for areas outside the US.  I very much appreciate this data being available.
The shading is relative and based on one of the ColorBrewer schemes with linear interpolation between the intervals, this is a convenient way of working with continuous data.


The graphic clearly shows that the favored location for windmills was either on the coast or along the chalk ridges that extend southwards from the Downs, only one appears to be located in a sheltered location.  Siting a windmill or turbine requires access to land, thus available locations may not always by the optimum ones.  The Google Earth screenshot below illustrates the competing uses for land.  In this case, the contours were generated using the SRTM 3 arc second data set.


Post mills are relatively portable, the machinery is mounted in a wooden structure which rotates around a post, a picture in a local museum shows one being moved on a sled drawn by oxen.  During their lifetimes five mills were moved to new sites either in one piece or in separate loads.  I have not studied the history of milling in the town, but I'm guessing that the early mills were built in the late 18th century to serve Brighton's growing population, however, as the demand for building land grew, the mills were displaced.  The screenshot shows the change of location of four mills, a fifth Preston Mill moved several miles to the north to Clayton where it is still in existence and has been restored and is now a listed building known as "Jill".  Towards the end of the 19th century the windmills came under the combined pressure of demand of building land and competition from steam and motor mills and their numbers dwindled.
Saturday 24 October 2015

Electricity Prices - The long view

Creating a time series of electricity prices compiled from actual bills has been a back-burner project for a few years.  I recently found a copy "Brighton and the Electric Revolution - 1882-1982" in the public library which provided data points for 1887 and 1893 and this has facilitated a revision of an earlier post.

Brighton on the south coast of England was one of the first towns in the world to have a public electricity supply.  Initially this was provided by private companies, towards the end of the 19th century, generation and transmission was taken over by the town council and later nationalized in the early post war years and then privatized in the 1990s.

Inevitably, getting like-for-like data for an industry which has been subject to technical, commercial and political change is difficult and thus the data in the graphs below should be treated with caution.  The gaps are being filled in as I find old electricity bills or advertising material.

The first graph is is from 1887 to 2015 with a log scale for the price in 2011 money which makes it possible to show a range of prices from 5p - 500p per kwh


The second graph starts at 1900 and has a linear scale for unit prices:

In the late 19th century electricity at £5/kwh in current prices was a luxury product but as generating capacity and demand increased, the prices started to fall and the displacement of gas as a means of domestic lighting began to accelerate.  Our family's experience suggests that it was only after the first world war that working families started to wire their houses for electricity in large numbers.  Initially electricity was only used for lighting, but by the start of the second world war many homes had vacuum cleaners, electric irons, radios and electric fires and a few had TV sets.  Often someone had to be ill before and electric fire was turned on because of the cost.  In the period following the second world war, prices were generally stable and possibly "cheap".  With the rise in oil and gas prices early in the 21st century, the prices of electricity started to rise and become a matter of political and economic concern.

Energy price forecasts can be a career graveyard, but it looks as if electricity prices in the 21st century will be higher than they were in the second half of the 20th.  The published "strike price" for nuclear power project appears to be around 9p/kwh and that for offshore wind around 12p/kwh, the consumer will pay transmission and distribution costs on top of these figures.  Nuclear and wind are only part of the energy mix, but it is not expected that oil and gas prices will remain at their current relatively low levels for a prolonged period.


Wednesday 30 September 2015

Doris - A thought experiment in progress (12) - And your point is?

Doris is a thought experiment running on a Raspberry Pi and a laptop which is intended to explore sustainable energy, an evolving description and discussion can by found in a previous posts starting with:
It is becoming generally accepted that energy storage can increase the proportion of energy generated from sustainable sources.  Regardless of my efforts with Doris, the aspiration supports international conferences and significant investments in technology are being made.  The concept is not futuristic, products such as Tesla's Power-Wall are coming to market and the internet-of-things which can provide data and control functions is evolving.  The question is where does it fit into the energy economy.  I'm an enthusiast for LED lighting, it works, I get payback (albeit on a small investment) and as we replace CFLs, our energy consumption is slowly falling.  For me as an energy consumer, the economics of storage don't work at present.

This is a well worn quote from the CEO of a cosmetics company; "In the factory we make chemicals and in the shop we sell dreams".  Similarly, we don't buy energy, we buy what it facilitates, e.g. lighting, cooking, entertainment etc.  Putting storage into the system does not cause us to use less energy, just gives us the option of increasing the diversity of sources.  Most consumers don't want a hike in their bills, but many might except higher unit costs if the total bill remained unchanged, thus a prerequisite to the adoption of storage might be energy management and efficiency which creates a cash flow for investment in storage.

At an industry level, the sustainable energy generation capacity is increasing, largely due to offshore wind farms.  However, wind farms are underpinned by conventional generating capacity.  The graph shows a breakdown of the sources of electricity on a pair of Saturday afternoons in October, one was a windy day and the other a calm one:

On the calm day, the gas and coal take over from the wind. This is a reasonably simple investment situation based on producing a product and selling it.  Having read the accounts of some generating companies, the owners of some gas fueled plant view  wind as a competitor and a complicating factor in their economics.  From a sustainability perspective (using number picked from thin air) it better to have four gas fueled plants and two wind farm rather than five gas fueled ones and one wind farm.  Storage helps achieve this.  However, the process of investing in storage rather than generating capacity is a complex one.

In the post war period until the 1990s electricity generation was managed by the CEGB.  In recent years the ownership of generating capacity has become highly diverse.  Participants include banks (possibly because of their deep understanding of markets), privatized power stations and interestingly Scandinavian companies with experience of offshore oil and gas operations have taken a position in the UK offshore wind sector. Would a larger element of central planning give a better outcome for emissions and sustainability?


Friday 18 September 2015

Doris - A thought experiment in progress (11) - Flights of Fantasy


Doris is a thought experiment running on a Raspberry Pi and a laptop which is intended to explore sustainable energy, an evolving description and discussion can by found in a previous post:
It is important to remember that Doris is a computer simulation with some arbitrarily set parameters and rules, it exists only in the imagination and has no physical reality.

With a database and software background, it seemed that a good way to learn about wind and solar energy was to find a bunch of varied data sets and poke around them with SQL.  This has been instructive, but so to has gardening and looking at the location of old corn grinding wind mills.

Weather balloons are a source of wind speed data.  I'm guessing, but there is probably a GPS built into the instrumentation which provides the data needed to estimate the balloon's speed and direction.

Wind is fluid flow over a surface, for smooth surfaces like a calm sea, the friction is low compared to that created by a jagged urban environment. The effect of friction is greatest close to the surface, but at around 1,000 meters, it is much less significant.  I think any investment in wind power technology should be preceded by a site survey, but without that it can be useful to attempt to estimate the wind speed from a reference location, one way of correcting for height is this formula:

There a alternatives which give different results, but this one has the virtue of simplicity.  Most surface wind speed data is collected at 10 meters, the graph shows how the wind speed might increase with height, at 1,000 meters, it is almost twice as fast as at 10 meters.


This graph shows a wind speed distribution at 850 meters (a standard reporting level) which was compiled from weather balloon data.  The average speed is approximately 10.0 m/s, at the surface, the average speed in a similar location might be 5.0 m/s.

This data suggests that the sky is a good place to capture the wind's energy. There are some talented and created people who are attempting to do this; there are a couple of links at the bottom of the page which might be a good start to reading around the subject, one of them, the Makani project is backed by Google.  The designs seem to divide into two groups, one approach is to get the generator aloft with  a kite or ballon and feed the electric energy back to earth with a cable attached to the tether.  The other is to capture the kinetic energy with devices like kites or rotors and use this to drive a generator on the ground.

I have not run any upper air data through the Doris simulation software as one of the parameters of the project is that it should only model readily available product and services.  It's easy to find reasons for dismissing airborne wind energy devices but fuel cells used to be exotic but now the technology is being incorporated into production automotive vehicles, so someone might make it work commercially.

Related material

Wednesday 16 September 2015

Doris - A thought experiment in progress (10) - Urban Wind

Doris is a thought experiment running on a Raspberry Pi and a laptop which is intended to explore sustainable energy, an evolving description and discussion can by found in a previous posts:
It is important to remember that Doris is a computer simulation with some arbitrarily set parameters and rules, it exists only in the imagination and has no physical reality.

Back in 2007, before the financial crisis, some DIY superstores were offering small wind turbines.  From what I remember, these had a nameplate rating around 1 kw (at 10 - 12 m/s, or 20 to 25 mph) and cost about £1,500 excluding mounting.  They could be installed either on a pole (10m high (?)) or strapped to a chimney stack (not a good idea).  Stories appeared in the press saying that they did not work too well and the take up was low.

There are several ways of working out the economics of a project, one of which is to watch how people behave, in the 1 km radius of where I live and walk my dog, I am not aware of any households with wind turbines, however, there are a lot with solar panels, mostly PV, but some thermal.  Solar panels will do something useful in any reasonably open south facing location, but turbines are very sensitive to location.

When I first started messing with this stuff, it seemed that there was a lot of data to play with, however, this is a lot of good quality information about the wind around airports, but but not much about urban and rural areas.  I have amused builders working nearby by standing in my backyard with a wind speed meter showing light airs when there is a gale blowing on the seafront a mile to the south.  Whilst trying to understand the variation in wind speed, I did a couple of cycle rides with a wind speed meter.

One of these was around the town, pausing to estimated the average speed over a 3 minute interval in a several locations, public parks, the beach, the cliff above the beach and multi-story car parks, these estimates were then compared to the speed reported from an airfield a few km to the west which was about 16 knots.  The result was this graph:
With exception one of the beach locations, the average speed was significantly less than at the airfield, equally significant was that nature of the wind which was often turbulent and gusty.

Another trip was up to the hills to the north of the town, I used the GPS on my phone to record the location of readings, which were then plotted on a contour map generated using data from the SRTM Space Shuttle mission and overlaid on Google Earth, the result was this map:


The figures are the ratio of the observed speed to that reported at the airfield.  This can be summarized as the wind speed is higher on the ridges than in the valleys, maybe a space rocket was not needed for that observation.

The accuracy of the measurements displayed on both these graphics is not high, but I think they give a reasonable impression.

I'm not convinced that small wind turbines are suitable for dense urban housing, I have memories of the 1987 hurricane that passed through the south of England when the air was full of tiles, trees and other debris, bits of wind turbine would not have been a welcome addition.  However, I am intrigued by some vertical axis designs that could be incorporated into a suitably strengthened roof.  A rotating machine strapped to a Victorian chimney is something no man can face with equanimity.

Running a data set of urban wind through Doris gave this graph.


For this run, the wind generating capacity was reduced to 0.5 kw.  The contribution for wind is significantly less than that of solar and does little to offset the seasonal nature of solar.  The data set was randomly selected and I'm guessing that there could be a wide variation in results, for example, a house located at the top of a ridge, might get a significant yield from a small turbine, whilst one in a sheltered valley would get almost nothing.


Sunday 13 September 2015

Doris - A thought experiment in progress (9) - Going offshore

Doris is a thought experiment running on a Raspberry Pi and a laptop which is intended to explore sustainable energy, an evolving description and discussion can by found in a previous posts:
It is important to remember that Doris is a computer simulation with some arbitrarily set parameters and rules, it exists only in the imagination and has no physical reality.

When I first started looking at wind as a resource, It became apparent that there is a considerable variation in the nature of wind, even within a small area.  For example where I live on the south coast of England, there are at least five regimes (the average wind speeds are for comparative purposes only):
  • The open spaces around an airfield, typically these are located in uncluttered areas away from hills and other natural obstruction to air flow.  Airfields are the largest source of wind speed data, but it may not always be relevant to wind turbines, the average speed might be 5.0 m/s.
  • Urban and wooded areas where the rough surface attenuates the wind speed and causes turbulence, mounting a turbine on a tall mast reduces the effect of these, but these may not be practical or desirable.  In this situation, the average wind speed might be 1.0 - 3.0 m/s.
  • Special locations, these include ridges and hills where the air flow is not obstructed by the surrounding terrain and may even be enhanced by it.  An average speed might be 6.0 m/s, data on these locations is hard to come by, but looking at the location of corn grinding wind mills can be instructive.
  • Offshore, relative to the land, the surface of the sea is smooth and losses to friction and turbulence are much lower, the average wind speed in an offshore location might be 7 - 9 m/s.  Data sources are offshore platforms and moored buoys.
  • Coastal areas.  When the wind is blowing off the sea it can be smooth, but when it is blowing off the land, it becomes turbulent.
The graphs below are not strictly comparable and only serve to show the difference in the nature of offshore and offshore wind.  Doris uses the latest available weather report, to form a distribution, it is preferable to have regular sampling, say, just use the reports that are on the hour.  The height at which the observations was made was probably different.  Height correction was not applied in the compilation of these graphs, although Doris does make some adjustment in estimating the energy that can be extracted from the wind.

For the onshore location, the mean wind speed is approximately 5 m/s and the distribution has a clearly defined mode at around 8 - 10 m/s.
 Offshore, the average wind speed rises to approx. 9 m/s, more importantly, the proportion of observations which are less than 5 m/s is much lower.
The amount of energy that can be extracted from a stream of wind is proportional to the cube of it's velocity, the wind flowing at 7.5 m/s has the potential to provide more than 3 times the energy of one flowing at 5.0 m/s.  This accentuates the difference between onshore and offshore wind.

Whilst the energy yield from offshore wind is potentially greater than onshore, so are the costs which might be two to four times higher.  The higher costs come from two sources, the first is the high cost of working offshore which requires similar equipment to that used by the oil and gas industry for building platforms.  Secondly, the installations need to have the resilience to withstand storm conditions and be tolerant of the corrosive effect of salt.  The relationship between onshore and offshore locations involves some complex economics.

Running an offshore data set through Doris produced the following graph (some software changes are needed to make the solar component in each graph comparable, they will be updated when this is done, however, the nature of the graph is not expected to change much).  To take account of the offshore data set, it was assumed that the access to wind generating capacity was reduced to 0.5 kw, it is 1.0 kw in the onshore base configuration.


The difference between the two plots is the lower draw down from conventional sources, this is in part due to the higher output and in part due to the smaller number of days when the yield from wind is low.


As with all the output from Doris, there are some gross oversimplifications, one of which may be the ability of wind farms to deliver energy at low levels, this needs to be understood and some allowance built into the model.

Author's Note

Due to some odd career advice, I left school at 15 and was for two year's England's most incompetent merchant seaman.  The fact that I have spent most of my working life writing computer software suggests I was not cut out for a life on the ocean wave. At the time I did not know that what I saw on lookout duty on the monkey bridge could be described in terms of wind speed distributions or Fourier transforms of wave motion.  In the context of this post, I appreciate the complexities of offshore operations and that offshore structures must be designed for extreme conditions, not average ones.


Friday 11 September 2015

Doris - A thought experiment in progress (8) - The winter problem

Doris is a thought experiment running on a Raspberry Pi and a laptop which is intended to explore sustainable energy, an evolving description and discussion can by found in a previous posts:
It is important to remember that Doris is a computer simulation with some arbitrarily set parameters and rules, it exists only in the imagination and has no physical reality.

In most energy economies without a significant amount of storage, wind and solar generators are alternatives to those fueled by gas, coal etc.  When the sun does not shine and the wind does not blow (as sometimes happens on a winter's night in December or January), the sustainable sources drop out and gas turbine stations kick in.  Whilst this is not explicitly stated in energy policies, there is a in effect a duplication of generating capacities.  This causes a variety of problems which include grid management where both demand and supply are related to the weather and economic ones.   Investors in conventional generating capacity may not want to participate in a back-up system to a wind farm, they probably want a free standing investment.

Energy policies which attempt to have a degree of sustainability need to take account of the winter problem,  Typically, this the time of year when the demand for energy peaks.

Storage at the household and some grid management at the neighborhood level might make a contribution.  The graph below shows the daily demand for electricity as modeled in Doris, this is roughly 6.8 kwh/day scaled up to four household, the demand has peaks at the start of the waking day and in the evening.  Say, each household has 10 kwh of storage, it could "download" its energy for the day over a six hour period by imposing a load of just over 1 kw on the grid.  Resorting to the usual gross over simplification, if each household does this in turn, the demand is constant over the day and approximately 60% of the level that would be needed if storage was not present in the system.

The upside of this scheme is that the amount of conventional capacity required is reduced and that the efficiency of most plant increases if it can be run at constant load rather than spinning up to take account of a period of light airs or a surge in the demand for hot water for tea making or spinning down when the sun comes out.  Maybe, there is the need for some creativity in ways to channel investment in generating capacity into storage and energy management, this is a challenge but something worth evaluation.

A variation of this theme is the problem caused by solar eclipses.  A recent eclipse during which the sun was obscured briefly over parts of Germany, which has significant solar generating capacity required some planning to avoid grid problems resulting from a sudden loss of power followed shortly after by a rapid surge.

Load management within the household could help reduce the peaks and troughs.  From a limited and unscientific survey, most of the potential relates to cleaning operations.  In many homes, the daily routine is based on meal times and these are more or less fixed.  Devices like the washing machine and the vacuum cleaner can be operated at times which harmonize with the availability of energy, however, this does require some planning.  I am intrigued by the concept of a robotic vacuum cleaner which comes out of its hutch when the solar panels are producing a surplus of energy and sucks up the filth from the living room.

I'm no advocate for returning to the living standards of our grandparents generation when running a household involved humping coal and ash, washing and cleaning were hard, monotonous work.  But there was an appreciation of the seasons and the weather, if possible washing would be done on a "good drying day".


Wednesday 9 September 2015

Doris - A thought experiment in progress (7) - Climate

Doris is a computer simulation designed to explore the use of sustainable energy by a typical household, it has no physical reality.

The post which describes the background to the project, also contains links to related posts.
The core functionality of Doris is the facility to make estimates of the output of wind and solar generators using aviation weather reports (Metars).  It is written in Python 2.7 and accesses historic weather data stored in an SqLite3 database.  The code is modified explore a range of configurations and scenarios, in this case climate.

When I first started seeking out data on wind and solar resources, it became apparent that  it was difficult to make like-for-like comparisons, this was largely due to variations in climate and terrain.  It's easy to look for an explanation in maths and stats, but a quick look through the travel section of a newspaper will provide an answer.  Many North Europeans take their holidays in Spain because of the clear skies and sunshine and few South Europeans trek north to in mid winter because of the wind and cloudy skies.  For wind turbines terrain is important, the ideal location for a turbine is on a ridge which is at right angles to the prevailing wind, when they are placed in valleys and urban areas they may not perform well.  Also the distribution over a country can vary considerably, for example in the UK, the average wind speed in exposed western coastal areas is higher than sheltered ones in the east. When comparing the experience of different countries, the variations in climate should be taken into account.

The base case for Doris is a location in the south of England (Koppen climate type: Cfb) with 1 kw each of wind and solar generating capacity.  The post "You have to do both" contains some discussion of a wind/solar based system might behave in this climate.

For this post, I've deliberately chosen some extreme and contrasting climates.  In the context of Doris, variations in climate come from the location which is used to provide estimates of clear sky solar irradiance, a crude model which provides some allowance for variations in cloud cover and weather reports from a local airfield.

The first graphic comes from a run where the base configuration was run with data from hot desert region (Koppen climate type: Bwh).  In this case, solar makes the greatest contribution to meeting the load, but at 35 deg. North of the equator, there is enough season variation to draw in supplies from the grid, the average wind speed in this place was low, so the yield from wind was low.

Based on the results from the base configuration, a possible adaption was to remove the wind generating component and double the solar capacity, the effect was to significantly reduce the draw down form conventionally generated sources.

At the other extreme is a northern continental area (Koppen climate type: Dfc) at a latitude of approximately 65 deg.  There is significant variation in the yield from solar over the year, this drops to zero in December and January, but provides a useful contribution in summer.  This arbitrarily selected location is not very windy and the contribution from wind even in winter is low resulting in a large draw down form the grid.

A logical adaption was to triple the wind generating capacity and halve the solar element, this still did not make a major reduction in grid draw down.

Since I have been studying sustainable energy sources, there is a recurring issue which might be termed the "winter problem".  In the northern hemisphere the demand for electricity peaks in the winter months whilst the supply can be low due to low solar radiance and periods of calm.  

Friday 4 September 2015

Doris - A thought experiment in progress (6) - The Mix

Doris is a thought experiment running on a Raspberry Pi and a laptop which is intended to explore sustainable energy, an evolving description and discussion can by found in a previous posts:


It is important to remember that Doris is a computer simulation with some arbitrarily set parameters and rules, it exists only in the imagination and has no physical reality.

Whilst scribbling lines of code, economics have deliberately been pushed into the background, but the loose assumption has been that both solar and wind generating capacity (excluding ancillaries like storage, inverters and bits of wire) each cost £1k/kw and the that the total cost is within sight of £5k and a lot of inconvenient issues have been ignored.   The rules which have been used suggest that a load of 2,500 kw/year can be matched with 2 kw of generating capacity.  The base configuration pretends it has 1 kw of wind and 1 kw of solar.  Changing the mix of wind and solar gives different results.

The objective is to minimize the dependency on conventionally generated sources.  These comments relate to a temperate maritime climate (Koppen: type Cfb), different climates would result in different results.  For example a hot desert (Koppen type: Bwh) would get a better yield from solar due to the relatively minor seasonal variations and the absence of cloud.  Subarctic climates (Koppen type: Dfb)
would get a low yield from solar due to the low sun and short days during winter months, in these places wind might offer a solution.

The graph shows the results of the simulations in which solar accounts for 25%, 50% and 75% of the generating capacity.  The graph shows maximum monthly draw down from conventional sources (which usually in December or January)  The dependency on conventional sources is lowest when the proportion of solar to wind is 25%/75%, this is primarily due to the low yield from solar during the winter.


In these simulations, the load is constant throughout the year, this is not realistic as the load would almost certainly be greater in winter than in summer  Future simulations may introduce seasonal variation in load, this will probably increase the amount of energy drawn from conventional sources with the low solar configuration.

A somewhat different results when the annual utilization of sustainable sources is plotted, in this case the high solar configuration uses approx. 82% of the energy it generates.  This is in part due to the high yield during the summer.  In its current form, the code gives priority to solar sources, but it is not thought that this has a major influence on the outcome (this may be tested in future simulations).

Sunday 23 August 2015

Doris - simulation, storage and sustainability (5) - Good and Bad Years

Doris is a computer simulation of household energy consumption designed to explore the relationship between storage and the consumption of energy from sustainable sources.  It exists only in the imagination and has no physical reality.  A description can be found here:
This page also has links to related posts.

Wind and solar powered generators are weather dependent systems, the data feed for Doris is weather reports, these are in real time on the Pi and historic on the laptop.  Climate is what you expect and weather is what you get.  In the UK our weather is influenced in turn by the land mass of continental Europe and the water mass of the Atlantic Ocean from which come a procession of depressions.  The result is a moderate, but varying climate.  The yield from Agriculture is in part influenced by the weather, for example in the period 2010 to 2014, the UK wheat harvest varied from approx. 12 to 16 million tons.

When I first became interested in sustainable energy, I started to seek out data on wind speed and solar irradiance and cycle around the town and local countryside with a wind speed meter, these exercises were undeniably instructive.  About the same time, I saw my house on Google Earth and became ashamed of the state of the garden.  I cleared the weeds, made an attempt to improve the flower beds and created a small vegetable garden.  This provides a small supply of misshaped vegetables of a quality that supermarkets refuse to stock .  It also taught me the relationship between sunshine and plant growth.  Beetroot grown in the partially shaded front garden are sad, weedy things, whilst those grown at the back in full sun are big enough to cook and eat, even though they are smaller than the imports from Spain and Egypt.  The seasons that shape a garden, also determine the output of wind and solar energy systems.  Solar panels have good and bad years, just like the harvests.

A useful piece of advice from a manager on whom I was inflicted, was "first make the code work, then make it work quickly".  Doris is still in the first stage and does not run quickly, so it had only worked through five years of data before I had to move on, ideally, you would need a much bigger sample to get an understanding of year-on-year variations, so this graph which shows the %age of energy taken from conventional sources only shows that there is year-on-year variation.


Some of the variation is due to variations in wind speed as shown in the graph below.  I have memories of the summer of 2013 as being sunnier than usual and this is reflected in the low dependency on conventional sources because of the increased output from solar panels under a clear sky.

Doris is intended to explore the response of a system which attempts to minimize dependency on conventional energy sources.  The output of coal and gas power stations can be varied to meed demand whilst that of sustainable systems is dependent on the weather.  In the 19th century, sailing ships started to be displaced by steam driven ones because they were more reliable.  The design of sustainable system need to be aware that the supply may be constrained.


Wednesday 19 August 2015

Doris - Simulation, storage and sustainability (4) - You have to do both

Doris is a computer simulation of household energy consumption designed to explore the relationship between storage and the consumption of energy from sustainable sources.  It exists only in the imagination and has no physical reality.  A description can be found here:
This page also has links to related posts.

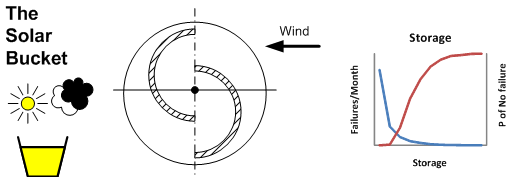
The current version of Doris is the third attempt to explore a sustainable energy system.  The first took place in 2007/8 which became known as the Solar Bucket.  This was simply a 4 watt solar panel connected to a small lead acid battery, during the day the panel charged the battery which was then used to support some form of load overnight, the most useful being an LED light.  The Solar Bucket worked OK during summer and less well during winter.  One of the lessons of this exercise was the effect of clouds on solar devices.  The second attempt was in 2013 which used the output of an imaginary wind farm to charge a bank of Ni-MH cells, if the make believe wind farm did not produced enough electricity, it kept itself alive using an old mobile phone charger.  This version ran erratically during the winter of 2013 and again in the spring of 2014.  The behavior of this system can be summarized as alternating between a few days on wind power and a few days hanging on the phone charger.

I took away two lessons from this experience, first that messing with hardware is a fun, but a slow way to explore a concept and a software emulation would be more efficient (and cheaper).  Secondly, for the location where I live which has a temperate maritime climate (Koppen type Cfb), a system which attempted to minimize dependency on conventional sources would probably need to utilize both wind and solar sources.

The graphs below show the result of three runs of Doris using historic data for 2011 using the base configuration with 10 kwh of storage and an annual load of 2,500 kwh.  In the first, the system has access to both wind and solar sources.  In its current form, Doris gives priority to solar energy, so the combined graph is biased towards solar and a different set of rules would give a different outcome, but it gives an indication of the direction of travel.

In this configuration, the peak demand for conventionally generated electricity is approximately 30% which can take place more or less anytime except summer.  When access is restricted to wind energy alone, the peak demand for conventional energy rises to 55% in summer with significant amounts being needed throughout the year.

In the solar only configuration, the dependency on conventional sources rises to 90% in winter, but less than 10% in summer.


As with all simulations, the output reflect decisions about the inputs.  for example, different results could be obtained by increasing the access to solar energy.  This would provide a surplus for export during the summer months with less dependency on conventional sources in winter.  The base configuration for Doris is loosely based on a 1 kw solar array (four 250 watt panels) and 1 kw of wind generating capacity.  The location of the wind capacity is assumed to be at a prime location.

History: originally posted on 19-Aug-2015 and revised 24-Nov-2015.

Images: blog_116


Monday 17 August 2015

Doris - Simulation, storage and sustainability (3) - Storage Sensitivity

Doris is a computer simulation of household energy consumption designed to explore the relationship between storage and the consumption of energy from sustainable sources.  It exists only in the imagination and has no physical reality.  A description can be found here:
This page also has links to related posts.

The base configuration for Doris is a household which consumes 2,500 kwh/year.  It is connected to the grid and has access to electricity from conventional, wind and solar sources.  In the base configuration (config 3) there is 10 kwh of storage.  Follow the above link for a more detailed description.  Incorporating storage into the household energy economy makes it possible to get a better match between the availability of electricity from weather dependent sources and the regular pattern of demand which comes from sleeping, work, college and preparing meals.

The proportion of sustainable energy consumed by a household from the grid is roughly 10 - 15% but on any given day this might vary from zero to 20% depending on the season and the prevailing weather. If a household has an element of storage, this might increase to 50 - 70%.  The Doris model assumes that the household has direct access to wind and solar sources, thus the output is not comparable to data from the national grid.

Obviously the the greater the amount of storage the better, but there are also economic constraints and this series of runs was intended to see where the law or diminishing returns set in with the objective of defining the base configuration.  As with any simulation, the output is determined by the assumptions used in the model and as there are many combinations, the graphs below only indicate the direction of travel rather than precise forecasts.

 The rules used by the Python 2.7 code give precedence to solar sources, if no solar generated electricity is available it then checks to see if there is any which has come from a wind farm, if insufficient power is available, the demand is met from storage and when this is exhausted if falls back on conventional sources from the grid.  Any surplus sustainable energy is used to recharge the storage.

The storage capacity affects the consumption of wind and solar sources differently.  The availability of solar sources is based on a 24 hour cycle with significant variations resulting from sun-earth geometry and cloud cover, thus diminishing returns set in with around 5 kwh of storage.  Wind energy tends to come in pulses a few days apart and the consumption of wind generated electricity increases with increasing storage.

The graph below shows that the proportion of energy from conventional sources falling as the storage capacity increaes.

Bases on these runs, the storage capacity for the base configuration was arbitrarily set at 10 kwh.  This is thought be a reasonable balance between cost and performance and there are available products for this capacity.

Note

This is a simulation, not real life.  This post was originally published on 17-Aug-2015 and substantially revised on 23-Nov-2015.


Friday 14 August 2015

Doris - A thought experiment in progress (2) - Energy Delivery

Doris is a computer simulation designed to explore the use of sustainable energy by a typical household.

The post which describes the background to the project, also contains links to related posts.
The core functionality of Doris is the facility to make estimates of the output of wind and solar generators using aviation weather reports (Metars).  The version running on the Raspberry Pi runs the base configuration and uses a live feed from NOAA, but the same code can be fed with historic data which makes it possible to explore a range of configurations and scenarios.

Wind and solar sources are weather dependent energy sources subject to seasonal variation, this distinguishes them from fossil/nuclear plant whose output is controllable.  Storage and diversity helps to match supply and demand.

The first graph shows the estimated breakdown of energy sources for a configuration with approximately one day's storage.  There are several things happening in this graph, the first is the seasonality of wind and solar sources.  Solar works well during the summer months, but makes little contribution during the winter.  Another issue is the constraints on the amount of energy that the system can import, these have been set at low levels and may restrict the amount of energy that can be stored.  During the winter months, the system falls back on to the grid more than is desirable. This is partly due to the differences in the pattern of delivery from wind and solar sources.


Wind energy comes in pulses at intervals ranging from a couple of days to a fortnight.  In winter during the calm periods, Doris maintains it's imaginary load from the grid.
In contrast the delivery of solar energy is regular, within a given month the greatest variation comes from variations in the nature of the cloud cover.
A relatively small amount of storage will provide a reasonable match between supply of solar energy during the summer and the load it is maintaining.  It is probable that a much larger storage capacity is needed to meet a constant load from wind sources.

The next step is to run a sensitivity analysis on the amount of energy taken from the grid and the storage capacity of the system.

Thursday 13 August 2015

Doris - A thought experiment in progress (1) - Background

Doris is a computer simulation designed to explore the use of sustainable energy by a typical household.

Doris lives in a simplistic and imaginary world, it poles weather reports from a randomly selected airfield which is near an imaginary wind farm. it has access to some fictitious local solar panels and thinks it is connected to the national grid. The meteorological data is used to estimate the wind and solar power that might be available. There is some storage built into the system and when more energy is available than is required to meet the load, it used to charge batteries. When the wind does not blow and the sun does not shine, the load is supplied from stored energy and when that is consumed it falls back on conventional sources from the national grid.  Energy from the wind farm is supplied from the grid whilst it is assumed that the solar panels are located on the consumer's site or on a local grid.

Doris - What is being simulated
It is the result of two activities:
  • Having spent much of life in the oil and gas industry, I felt the need to explore sustainable sources.  This included the academic study of things like wind speed distributions, climate, sun-earth geometry and the effect of clouds on solar irradiance.  There was also a practical element which included a 4.5 watt PV panel, a lead acid battery and an LED light known as the Solar Bucket plus a few cycle rides around the town and surrounding countryside with a simple wind speed meter.
  • In 2007, before the financial crisis, rooftop PV panels and wind turbines were becoming available and I became curious to to know if it was possible to economically reduce household reliance on the grid by using these products.
Both of these efforts came to the same conclusion, that increasing the proportion of household energy coming from sustainable sources was a challenge.  Some caveats are necessary before making any conclusions:
  • Economics are important, any alternative to fossil fuels must deliver the same benefits for a comparable cost, if it does not, no one will adopt it.
  • The technology is the key technology because it separates production and consumption into two separate processes.
  • Much discussion of sustainability focuses on generation, yet managing and reducing consumption is, maybe, more important.  Sustainability is easier to attain if the demand is low.
  • The nature of a sustainable solution is dependent on the climate in which it is installed, thus the experience of one country may not be relevant to another.  Solar PV might work well in the deserts of Arizona, but less so in the highlands of Scotland where wind turbines are a more attractive option.
The conclusions I came to for a location in the south of England were:
  • Solar PV works well in summer, but not in winter.  On a sunny summer day, the cumulative GHI might be 8 kwh/m2, whilst on an overcast December day it can be less 1 kwh and that is the time of year is when energy consumption is at a peak.
  • The most effective way of generating energy from the wind is from industrial scale wind turbines located in optimum locations such as onshore ridges and offshore.
  • Both solar and wind are discontinuous sources of energy, the sun does not shine at night and wind energy comes in pulses which can be several days apart.
  • Wind and solar sources will not be able to fully displace fossil fuels in the short term but the proportion from sustainable sources can be increased.
A system which could mitigate some of these issues for a typical household might look like this:
  • Focus energy consumption and management on storage with a capacity of 5 - 10 kwh.
  • Only draw energy from the grid when equivalent amounts of energy from sustainable sources are being fed into it.
  • Ensure that there is access to both wind and solar generating capacity.
  • Use energy generated from conventional sources only when the storage is depleted and sustainable source are not available.
Such a scheme might increase the proportion of sustainable energy consumed by a typical house to around 70%.

Doris is software which can be modified to explore ideas without the expense which would be incurred by working with expensive real things.  Several configurations and scenarios have been run and these are described in the following posts:
Simulation is not real life, so the results should be treated as a possible direction of travel rather than detailed predictions.  At the time of writing, these posts are being edited and are subject to change.

Doris can runs in two modes:
  •  On a Raspberry Pi with live data from NOAA via an internet connection.  The Pi runs the base configuration and is capable of uploading graphics to a shared server.  In this case, the behavior of the software has some relation to the weather on the other side of the window.
  • Much the same code runs on a laptop using historic data from an SqLite database, this allows different scenarios to be run against the same weather data or similar configurations with different weather data.
   The data flow looks like this:

Doris - Data flow
Doris is work-in-progress. The first iteration used an old laptop, an interface card and a home brewed bank of Ni-MH cells, the computer obtained weather data from the internet and made decisions which it implemented using the interface card and tried to maintain a small load without recourse to the grid (in reality a discarded mobile phone charger). Whilst this was both entertaining and instructive, it was an inefficient way of exploring the concept, not least because of the energy overhead of the aging laptop and the risks associated with my dubious knowledge of power electronics.

Doris - The first attempt, a second would be nicer
Whilst there are significant technical and commercial issues associated with implementing a "real" version of Doris, it is economics which presents the greatest challenge.  Whilst the virtual world of Doris has the potential to reduce emissions by maximizing the use of energy from sustainable sources, the economics don't look good. The retail consumer has two pricing options, either a single tariff or something like Economy 7 which offers electricity for around 7 p/kwh in the wee small hours and at least twice that during the day. Solar generated electricity is almost by definition can't be bought off peak because the sun does not shine at night. For this scheme to be viable there needs to be some innovation in the energy market which gives producers are reasonable rate of return and reduces the reliance on fossil/nuclear sources. One possibility is for users to have a stake in the ownership of  generating capacity rather than buying its output at a unit cost.

The base configuration of Doris was chosen such that the installed cost of a non-imaginary system would be within sight of £5k, this is summarized as:
  • Annual energy consumption: 2,500 kwh (approx. 7 kwh/day)
  • Storage capacity: 10 kwh
  • Solar generating capacity: 1 kw
  • Wind generating capacity 1 kw
The methodology for estimating solar irradiance under a cloud sky is evolving and is part of a separate project, the method used for Doris has a pragmatic element to it and hopefully will evolve.

Some of the work from which Doris originated is described in these posts:
Who was Doris?

I first heard the expression "I'm Doris, the goddess of wind" from an old bloke I worked with in a sheet metal factory.  There's a lot of wit in factories along the lines of "The water is safe to drink because it's been passed by the management".  The Doris quip stayed with me and then someone invented the internet and Jimmy Wales started Wikipedia.  This tells me that it was the catch phrase of Douglas Byng who is described as an English comic who trod the boards before and after the second world war.  As many software titles get subverted, it seemed a good idea to start with something that was already ambiguous.

This post was revised on 03-Nov-2015


Saturday 18 July 2015

Lead was all around

Hancock's "Half Hour" and "Steptoe and Son", both comedy series written by Galton and Simpson in the 1960's and 70's had more than one reference disreputable characters stealing lead from roofs.  I am reliably informed that one of the murder weapons in the game of Cluedo is a length of lead pipe.   If there was a lot of lead in light entertainment, there was even more of it in Victorian and Edwardian buildings.

In the last couple of years I've more or less become my own builder and whilst renovating my house have come across a lot of lead in one form or another.  To the best of my knowledge, lead is only used for roofs and flashing in modern structures.

Lead roofing
The attraction of lead as a building material is that it is malleable and does not corrode.  From a half remembered conversation with a retired builder, there was once a specialist trade of lead workers whose principle skill was to beat lead sheet into the complex shapes drawn by architects.  The term plumber (which means lead worker) was reserved for people who worked with lead pipe.

At the time our house was built, all the plumbing was lead tubing, working with this stuff would have been hard, a 10 metre run of pipe would have been heavy and it probably needed two men to install, one to do the bending and another to support the pipe until it could be secured to the structure.  Relative to modern plastic plumbing, forming joints and connections would have been a lengthy and skilled task in which the pipe and solder(?) had similar melting temperatures.

A tee junction in lead piping
I was surprised to find lead had been used a sheath for electric cables which might have been installed around 1911.  I'm guessing, but one of the problems with early electric cabling might have been water induced breakdown of insulation.  Whilst lead was not an obvious choice of sheathing material, it would have provides some protection against water.

Lead Sheathed Cable
One of the attractive features of Victorian and Edwardian houses is stained glass windows.  These are segments of glass held together with I-section lead piping.  Over time stained glass windows can sag if they are exposed to the sun and fatigue if they are mounted in doors, thus you get a bill for restoration approximately every hundred years.


Apart from drafts rattles, sash windows are an attractive feature of Victorian houses, concealed in the frames are four counterweights, in the case of our house, there is more than quarter of a ton of cast iron in the windows, however, in grander properties with large windows, lead was used for the sash weights.

Lead would also have been present in accumulators which were used for door bells and other signalling devices and later to heat the filaments in valve radios.  Local shops offered to charge up the accumulators, maybe for a shilling, which was a very expensive way of buying electricity.

Various lead based materials were in regular use, the most common was paint.  Lead paints had a reputation for durability and the pretense of lead implied a premium product.  Whilst lead is no longer used in paint, its previous large scale use makes it necessary to take precautions when sanding down old doors and window frames to avoid inhaling the dust.  Another one was "red lead" which was a sealing compound used with iron and brass pipe fittings.

Until relatively recently tetra-ethyl lead was used in petrol to prevent "pre-ignition" and was often referred to as an "anti-knocking" additive.  The engines in early cars were large had low compression ratios, for example the Model T ford had a swept volume of 2900 cc and a compression ratio of around 4.  When lead as added to petrol, compression ratio could be increased to around 7 or 8 which increased the efficiency of the engine allowing the size of engine to be reduced for a given output.  At the end of the 1930s small cars typically had 1,000 cc engines.  At one time petrol was sold according to with its octane rating denoted by a number of stars and the higher the octane rating, the higher the price and lead content.   By the 1970s, the used of lead in petrol was seen to be detrimental to public health and its used was phased out.


Saturday 11 July 2015

Zen and the art of.......

I've always had a grudging admiration for "Zen and the art of motorcycle maintenance".  I see where it is coming from, but I once owned an aging BSA C15 250 cc single.  This bike facilitated my 50 mile./day commute for three years and a few ill-advised long distance rides whilst at university.  There is a passage in the book which describes adjusting tappets on something desirable which is parked under a shady Californian palm tree.  This is in marked contrast to placing the cylinder head of the BSA in sterile environment of my mother's oven in an attempt to replace well worn valve guides which were causing oil and petrol consumption to be about equal.  The mobile workshop which was my Belstaff waterproof never lacked a feeler gauge for tappets and points adjustment.  To be fair to the C15, once big-ends had been replaced, the cylinder re-bored and anything that generally needs to be replaced on a motorbike, like chains, clutch pads and oil had been replaced it was reasonably reliable, but I never sat under a palm tree with it feeling at one with the world.

Some decades later, I decided to confront the plumbing in my house.  The object of plumbing is to move water from some ill-defined location to a tap where one use it to clean vegetables or hatch beautiful/creative thoughts whilst languishing in a hot bath.  When the house was built in 1901, it probably did both these things well, but somehow progress got in the way and the bath water cooled and creative thoughts became a thing of the past.

Pipework which is not at one with the world
When the house was built, lead pipes fed a few taps and a gas fired geyser, a simple, functional arrangement albeit with the attendant risks of gas explosion and carbon monoxide poisoning, both of which could be mitigated by opening a window.  The first enhancement was the addition of a back boiler to the cooking range, this would have been OK, had the pipes not been made of iron and by 1949, bath water would have been a trickle of dark red fluid which gave the occupiers the appearance of  fake tan combined with poor personal hygiene.

I'm guessing, but the solution was probably a solid fuel boiler with copper pipes, whilst this was step forward, the only way of moving water around the house was "gravity feed".  The attraction of a gravity feed system is that it is cheap to install, the downside is that it is inefficient.  A pump to move water around the house improves things considerably.  The occupants of the house continued to be cold and dirty.  Sometime in the 1980s a pumped system arrived, but there were three generations of pipework in place, lead, iron and imperial copper.  It was probably cheaper to route the new pipe via London than remove the old stuff and offset the long and winding path with a massive boiler.  Nobody involved had read "Zen and the art of motorcycle maintenance".

It's reasonably easy to protest against airport expansion, you just turn up and wave a placard around and maybe make a some new friends.  It's much nobler to tackle one's own plumbing.  Over the past two months I have ripped out a century of pipework and replaced it with short, insulated runs and to my surprise/relief we have reduced our CO2 emissions and enjoyed the luxury of a hot bath.

Sadly, when I sit in the bath, I still do not feel at one with the world, but I still appreciate where "Zen and the art of motorcycle maintenance" was coming from.