Comment
This was written over a year ago to gather together thoughts and observations on the relationship between clouds and solar devices. It has not been formally reviewed, thus it should be treated with caution and as a discussion.
Solar Devices
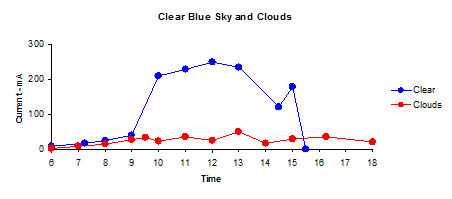
The first graph shows the current delivered to the battery between 06:00 and 18:00:
The second shows the charge supplied to the battery (in mA hours):
The "clear" and "clouds" represent the extreme cases, most days are a mix of blue sky and passing clouds.
On days when the sky state consists of a few, scattered or broken clouds there will be significant fluctuations in irradiance within a short space of time (and hence output) as can be seen in the graph below:
At the time these measurements were recorded, scattered cloud was present at an estimated height of 2 - 4,000 feet.
The Sky over Southern England
The bubble chart shows the states of the sky over southern England during a year:
The graphic does not give a full description of the sky. In summer the low cloud is typically a thin layer of cumulus which has only a moderate attenuating effect whilst in winter, the sky is overcast with a thick layer of stratus.
 |
| Summer |
 |
| Winter |
 |
| Summer |
 |
| Winter |
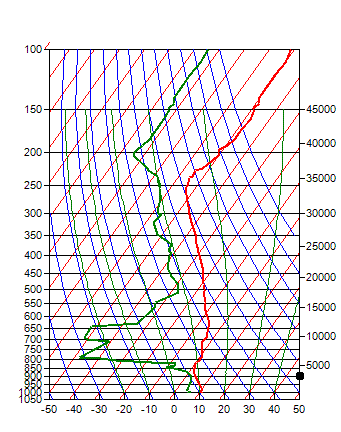
SkewT diagrams are complex, but a lot of information can be obtained visually.
When the temperature and dew point lines are far apart, the relative humidity is
low, as is the proability of cloud formation, when they are close together, the
relative humidity is high and it is probable that clouds have formed. In
the left hand diagram, the cloud is probably a thin layer of cumulus as shown in
the photo above. In winter, the high relative humidity resulting from
lower temperatures may allow can allow a thick layer of cloud to form.
Solar devices and the human body generally don't make too much
distinction between a clear blue sky and one with a few clouds in it, but a thick
overcast layer can reduce the amount of solar radiation reaching the Earth's
surface by more than 80%. This can reduce the output of solar devices and
creates a desire in the English to move closer to the Equator.
What Clouds Do
What Clouds Do
The effect of clouds is to reduce the amount of the Sun's radiant energy
transmitted to the Earth's surface. Part of the energy is reflected
upwards and part of it is absorbed within the cloud itself. This is
illustrated in the diagram below:
It shows that effect of clouds during winter is much greater than during the summer months.
Describing the effect of Clouds
There are many ways of describing the effect of clouds. Most of the comments on this site are based on the Clear Sky Factor (CSF for short), This is the ratio of the observed global horizontal iraddiance (OGH) to estimated clear sky global horizontal irradiance:
Under a clear sky, the value of CSF is constant at 1.00, under a thick, overcast sky it is usually in the range 0.1 to 0.2
The choice of GHI as a basis for a ratio is pragmatic, GHI is the most readily available form of solar irradiance data and secondly it is relatively independent of device geometry.
The second measure is the diffuse fraction which is the ratio of diffuse irradiance to total irradiance:
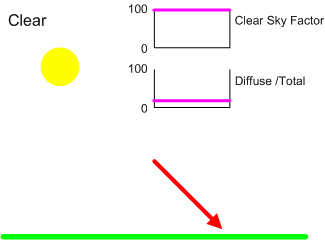
The diagrams below show how CSF and DF change with the state of
the sky. These diagrams are idealised, even a casual glance at a
clouded sky suggests that there is strong random element in the behaviour
of clouds and for this reason it might be desirable to model CSF and DF as
probability distributions.
Clear Sky
Under Pure Clear Sky conditions, there is no attenuation, the value of CSF is 1.00 and the diffuse fraction in the range 0.05 – 0.15.
Overcast Sky
At the other extreme, the modal value of CSF for a thick overcast sky is around 0.2 with a relatively narrow variation, say in the range 0.1 to 0.3. No direct sunlight reaches the ground and the diffuse fraction is constant at 1.00
The Cloudy Sky
The cloudy Sky is an intermediate state between clear and overcast. A common scenario is for cloud masses to move across the sky propelled by wind. When a sensor on the ground sees clear sky, the instantaneous value of CSF is around one and the diffuse fraction will be greater than under a clear sky. It is possible in the case of FEW clouds or high level clouds that CSF will exceed one due to the additional diffuse irradiance. When the Sun is obscured by cloud, there will be little or no direct irradiance and the diffuse fraction will approach one. Over a time interval, say 15 minutes, the time average of CSF will be proportional to the amount of cloud cover.
Precipitation and Obscuration
Rain, snow and fog are frequently associated with low, dense cloud, added to which is a layer of large droplets of liquid water. The effect, depending on the intensity of the weather is to lower the value of CSF below that expected from overcast cloud, sometimes to around 0.05.
A special case of the effects of weather on solar devices is when the receiving surface becomes covered in snow, in this case the CSF falls to zero, even though pure clear sky conditions may prevail.
The effect of Height
Cloud types are divided into three groups, low, medium and high. Low clouds are those between ground level and 6,000 feet, their formation is influenced by conditions on the ground. High clouds exist above 18,000 feet and are composed of ice crystals. It is less common for medium level clouds to exist as a single layer, they are often part of a complex sky during periods of changeable weather.
Weather reports usually only provide information on the extent of the cloud and the height of the base above ground and sometimes the type (e.g. cumulus, cirrus etc.), they do not describe the thickness. The thickness can be a function of the climate type and season, for example, the description OVC020 (overcast with the base at 2,000 feet) might describe a thin layer of stratocumulus in in a Californian summer or a thick layer of nimbostratus during a European winter. Also as the extent of the lower layer increases, less is known about the layers above, thus in the example above, there could be several layers of cloud above the overcast at 2,000 feet. The comments on are based on observations of single layers of cloud and because of the issues outlines above, should be treated as generalisations. As the complexity of the sky increases, conditions become overcast.
Low cloud has the greatest attenuating effect. Skies described as having a single layer of few, scattered or broken cloud typically have CSF values in the range 0.4 to 0.6 when the sun is obscured by cloud. The length of the period of obscuration increases as as the extent increases. As the extent becomes overcast the range of CSF values can extend from 0.6 right down to less than 0.1. The lower values being associated with thick layers of stratus or nimbostratus often with bases around 1,000 feet.
In most cases, high clouds such as cirrus have a relatively small attenuating effect ,an overcast sky of high level cloud might might have a CSF value of 0.8.
 |
| Add caption |
The cloud also changes the nature of the irradiance. The cloud
acts as a diffuser, when the Sun is obscured by a cloud, the irradiance is
not only attenuated, but becomes diffuse.
The proportion of energy transmitted is a function (amongst other
things) of the type of cloud, its height and thickness, the nature and
extent of the cover and the time of day. All of which conspire to
make it difficult, if not impossible to model the process.
The Seasons
Whilst the attenuating effect of clouds is a combination of reflection and absorption, there does seem to be a link between the thickness of a cloud layer and its attenuating effect. In winter, the base of low level cloud falls and the thickness increases as does the zenith angle. The graph below was inferred from data collected by the Electric Solar Bucket in the South of England.
Whilst the attenuating effect of clouds is a combination of reflection and absorption, there does seem to be a link between the thickness of a cloud layer and its attenuating effect. In winter, the base of low level cloud falls and the thickness increases as does the zenith angle. The graph below was inferred from data collected by the Electric Solar Bucket in the South of England.
It shows that effect of clouds during winter is much greater than during the summer months.
Describing the effect of Clouds
There are many ways of describing the effect of clouds. Most of the comments on this site are based on the Clear Sky Factor (CSF for short), This is the ratio of the observed global horizontal iraddiance (OGH) to estimated clear sky global horizontal irradiance:
Under a clear sky, the value of CSF is constant at 1.00, under a thick, overcast sky it is usually in the range 0.1 to 0.2
The choice of GHI as a basis for a ratio is pragmatic, GHI is the most readily available form of solar irradiance data and secondly it is relatively independent of device geometry.
The second measure is the diffuse fraction which is the ratio of diffuse irradiance to total irradiance:
Under a clear sky, the diffuse fraction is typically around 0.15 whilst under an
overcast sky is constant at 1.00
The effect of increasing extent
Clear Sky
Under Pure Clear Sky conditions, there is no attenuation, the value of CSF is 1.00 and the diffuse fraction in the range 0.05 – 0.15.
Overcast Sky
At the other extreme, the modal value of CSF for a thick overcast sky is around 0.2 with a relatively narrow variation, say in the range 0.1 to 0.3. No direct sunlight reaches the ground and the diffuse fraction is constant at 1.00
The Cloudy Sky
The cloudy Sky is an intermediate state between clear and overcast. A common scenario is for cloud masses to move across the sky propelled by wind. When a sensor on the ground sees clear sky, the instantaneous value of CSF is around one and the diffuse fraction will be greater than under a clear sky. It is possible in the case of FEW clouds or high level clouds that CSF will exceed one due to the additional diffuse irradiance. When the Sun is obscured by cloud, there will be little or no direct irradiance and the diffuse fraction will approach one. Over a time interval, say 15 minutes, the time average of CSF will be proportional to the amount of cloud cover.
Rain, snow and fog are frequently associated with low, dense cloud, added to which is a layer of large droplets of liquid water. The effect, depending on the intensity of the weather is to lower the value of CSF below that expected from overcast cloud, sometimes to around 0.05.
A special case of the effects of weather on solar devices is when the receiving surface becomes covered in snow, in this case the CSF falls to zero, even though pure clear sky conditions may prevail.
The effect of Height
Cloud types are divided into three groups, low, medium and high. Low clouds are those between ground level and 6,000 feet, their formation is influenced by conditions on the ground. High clouds exist above 18,000 feet and are composed of ice crystals. It is less common for medium level clouds to exist as a single layer, they are often part of a complex sky during periods of changeable weather.
Weather reports usually only provide information on the extent of the cloud and the height of the base above ground and sometimes the type (e.g. cumulus, cirrus etc.), they do not describe the thickness. The thickness can be a function of the climate type and season, for example, the description OVC020 (overcast with the base at 2,000 feet) might describe a thin layer of stratocumulus in in a Californian summer or a thick layer of nimbostratus during a European winter. Also as the extent of the lower layer increases, less is known about the layers above, thus in the example above, there could be several layers of cloud above the overcast at 2,000 feet. The comments on are based on observations of single layers of cloud and because of the issues outlines above, should be treated as generalisations. As the complexity of the sky increases, conditions become overcast.
Low cloud has the greatest attenuating effect. Skies described as having a single layer of few, scattered or broken cloud typically have CSF values in the range 0.4 to 0.6 when the sun is obscured by cloud. The length of the period of obscuration increases as as the extent increases. As the extent becomes overcast the range of CSF values can extend from 0.6 right down to less than 0.1. The lower values being associated with thick layers of stratus or nimbostratus often with bases around 1,000 feet.
In most cases, high clouds such as cirrus have a relatively small attenuating effect ,an overcast sky of high level cloud might might have a CSF value of 0.8.


No comments:
Post a Comment