This project is an attempt to produce a simple model for diffuse irradiance in southern England.
Comment
This is work in progress and has not be reviewed and should be treated with caution, It is an update on earlier one entitled "Then Diffuse Fraction" which has been deleted.
The Equipment
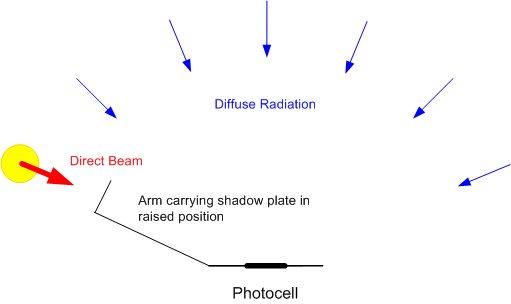
The equipment consists of a flat photocell mounted on a horizontal surface. This photocell has good cosine response. The short circuit current of the photocell is directly proportional to the irradiance, in this case the short circuit is provided by a 10 watt 1 ohm resistor, the voltage across indicates the current through the cell. An arm mounted in front of the cell carries a shadow plate. When this arm is raised, the photocell is in shadow and only receives diffuse radiation, when it is lowered, the photocell receives both diffuse and direct radiation. The concept is shown in the diagram below:
The device is constructed from Meccano and plywood. Three screws provide a means of obtaining a horizontal surface as indicated by a level gauge.The photo shows equipment in use.
Observations
Data is collected on days when a large part of the sky is clear, such days are rare in the south of England and accumulating a workable dataset is proving to be a slow process. Ideally, the analysis should be based on a full year's data, at the time of writing, there is only eight months from May 2013 to December 2013.
Observations have been made in a number of locations. For air mass values in the range 1.5 to 4.0 (mid morning to mid afternoon), the data appears to be similar for any open space, such as a public park ringed with trees. For higher values of air mass (around dawn and dusk), it is preferable to cycle to a south facing beach.
Dogs
One of the hazards of collecting data in public places is the attention of dogs, I like dogs, so this is not a problem, but it has resulted in some curious observations, for example, a freshly laundered poodle has a much greater effect on diffuse irradiance than a mud splattered labrador. This is thought to have no scientific interest.
General Comments
An important part of the data collection process is the notes taken at the time, these provided an explanation for some of the variance.
- Haze. This was present on several summer days, the effect was to increase the diffuse irradiance to over 200 watts/m2.
- Low Level Cloud. If cumulus is forming or present in the sky, the diffuse irradiance will rise above the clear sky level. The presence of low level cloud implies that the relative humidity in the lower part of the atmosphere is close to 100%. In an otherwise clear sky, small fragments of cumulus can form and disperse very quickly. It seems that the formation of a cloud is preceded by an increase in diffuse irradiance.
- High Level Cloud. Except when the high level cloud is between the sun and the photocell, high level cloud causes little or no increase in the diffuse irradiance.
- Jet Trails. Occasionally, the total irradiance would dip as an airliner came between the Sun and the photocell. One morning, a larger than average jet trail appeared, this was probably created by an Airbus A380 bound for one of the Paris airports.
- Morning/Afternoon Variations. It is common for there to be significant differences in the irradiance before and after solar noon. In the south of England it is common for the sky to be clear during the first half of the morning after which clouds start to form, as a result, the irradiance is higher in the morning than the afternoon. In other climates, irradiance can be at a maximum in the early afternoon.
- Seasonal Variations. Two factors which influence solar irradiance are the water content of the atmosphere and aerosols and these vary according to the season and climate. In southern England the water content is higher in late summer and early autumn than in the winter months.
Calculations
In the South of England, the "economic" range of air mass is approximately 1.5 to 6.0. In this range the plane parallel method of calculating air mass provides a reasonable approximation and some computational convenience. The calculation (with the exception of the equation of time) is described on this page:
Sun-Earth Geometry
Results so far.
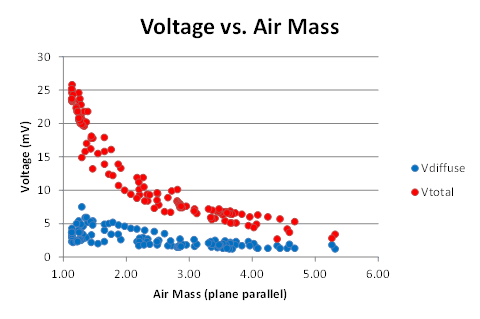
The first graph shows the voltages plotted against the plane parallel air mass:
Extracting the diffuse measurements and breaking them down by the state of the sky gives this graph:
The data for hazy days and those when there were a few cumulus in the sky are distinct from those when the sky was almost free from cloud or contained a few or scattered high level cloud such as cirrus.
First Attempt at a Model
Experience with this photocell suggests that its sensitivity is approximately 40 mA per watt/m2 as the resistor is 1 ohm, this becomes 40 mV per watt/m2. Discarding the haze and cumulus and amalgamating the clear and cirrus set and expressing the results as watts/m2 gives:
This is a reasonably tidy dataset, however data is not evenly distributed across the range of air mass, however, a simplistic curve fit using the same form of equation as the Meinell model has been attempted. It is probable that as more data is collected, the values of the constants will change.
At the time of writing, only limited testing has been done using this diffuse irradiance model. It appears that when combined with the Meinell model it produces better estimates of global horizontal irradiance than simply making the diffuse element a fixed fraction of the direct beam component. The graph below shows an estimate of the global horizontal irradiance for a clear, June day on the South cost of England, this appares to be reasonable when compared to the output of a personal weather station.
A more systematic evaluation will take place when a full year's data is available.
Correlations
For most locations, not much is known about the state of the sky at any given time. The nature of the irradiance can be source of information about the atmosphere. Initial attempts to correlate the data with derivatives of temperature and dew point data from the surface weather reports from the nearest airfield (approx. 7 km to the west) have not been successful. An initial attempt has been made to use data from NASA Aqua satellite obtained from the NASA Earth Observations website and this suggests an interesting line of enquiry.
If the data is broken down into three bands defined by aerosol optical depth, there is a suggestion that the data will segment:
Some of the highest values of V diffuse were observed when haze was clearly visible and haze is associated with high values of AOD, similarly, the lowest values were obtained when the AOD was also low. This is to be expected because AOD is one the inputs to parametric models of solar irradiance and it is also used as indicated of air quality.
A similar exercise with water vapour as less conclusive.
Variations on this theme using parameters based on surface temperature and dew point produced similar results.
Future Work
There are three tasks:
- Continue collecting data when the opportunity arises until at least until April 2014 to obtain a dataset extending over a full year.
- Determine if the same process can be extended to create a location specific model for direct normal irradiance. This can be calculated from measurements of global and diffuse horizontal irradiance, however, the equipment in its present form may not be able to provide data of adequate quality without modification.
- Attempt a model which accounts for seasonal variation.
Acknowledgement and Appreciation
Data relating to Aerosol Optical Depth and Water Vapour was obtained from the NASA Earth Observations website. The data available on that site is highly instructive and I would like to express my appreciation to NASA and NOAA for making it available.


No comments:
Post a Comment