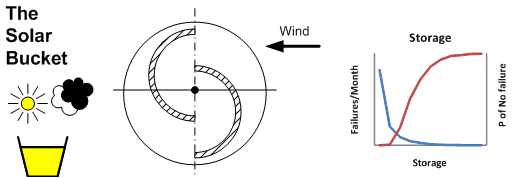
Monte Carlo simulation is one way to explore the interaction between supply, demand and storage. The concept is simple, you throw random events as a mathematical model and see how it behaves, whilst this may sound abstract, its more than a bit like real life. The name was comes from the roulette wheels in the casinos of Monte Carlo in the 19th century, in a fair and decent world, these devices are true random number generators. If the technique was being named today, it might be called Vegas Values.
The example is based on a simplistic model of a system with three components, a small wind turbine, battery storage and a load. The example has been set up such that the average supply and demand are both 1 kwh.day, however, the distribution of the supply and demand are different, and it is probable that on any given day, supply and demand will not balance. There could be large demand for energy on a calm day or little demand on a windy one. The inclusion of storage in the form of a battery helps match supply and demand. In this example, we want to understand the effect on system reliability for different amounts of storage.
The core of the model is shown in the flow chart:
This is a very simplistic model, so a single function is used to return a triangularly distributed random number, the arguments being the minimum, mode and maximum values. The Python code for this simulation can be found on our website. The principal variable is "storagesize" which is the capacity of the battery in kwh. The output of the program was used to create the graph below.
This simplistic model of a hypothetical system suggests that increasing storage reduces the probability of system failure but at the amount of storage increases, the law of diminishing returns set in.
Related Material
Monte Carlo Simulation
Triangular Distribution


No comments:
Post a Comment