One of the reasons for modelling a system is to get an understanding of how it might work before you build it, the logic being that paper are spreadsheets are cheap whilst metal and earth moving are expensive. There are many ways of doing this, one is to use historic data as the input, for example a time series of wind speed measurements, another is use some form maths/stats function to mimic the real world. Each approach has its strengths and weaknesses.
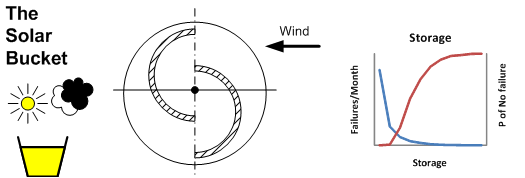
I'm currently messing with a storage based project, some initial work was done on a computer, but to make it a bit more fun, I'm building a very small prototype which is controlled by weather reports from the internet. This provides some insights which a purely maths and stats approach would hide, not the least of these is the economics of the process. In a mathematical model, changing a parameter is often just a matter of editing a line of code, with a physical model, changing something usually involves a cycle ride and spending money. This has forced some decisions on how much information is needed to drive the system and what is nice-to-have which leads to a discussion on the merits of a big budget which allows flexibility and experimentation or a small budget in which constraints may foster creativity. Such is life at the cutting edge of R and D.
As with anything on this blog, this is unreviewed work in progress which should be treated with caution.
When I first became interested in sustainable energy systems, I found a source of data which provided the average wind speed for a given location. the figure for my backyard was 5.0 m/s (I think), this might be the case for level ground devoid of trees and houses, but it was a start. To make an estimate of the energy that might be extracted from a stream of moving air, it is necessary have a distribution of the wind speed. One solution is to use the Rayleigh distribution, which with the help of spreadsheet can take an average wind speed and turn it into a histogram which is an estimate of the of the number of hours per year a given wind speed will occur. The Rayleigh distribution is a special case of the Weibull in which the shape factor is fixed at 2.0 which simplifies the process. Both the Rayleigh and Weibull distributions can be used to model wind speed. The relationship between the maths and the wind is empirical which simply means "it works" without a providing a causal mechanism. This sort of model is common in science, the goals scored in a football match can follow a Poison distribution, rainfall can follow a Gamma distribution, extremes can be described with the Pareto and Gumbel distributions (amongst others).
The graph below shows the distribution of wind speed which is estimated by the Rayleigh model and observed wind speed for a selected location with an average wind speed of 5 ms/s:
In this case, there is reasonable agreement between the estimated and observed values, in part because the dataset was chosen for this reason.
As part of a project to learn about the nature of wind as an energy source, I collected data from diverse location, which I'm still studying. The inference from this, so far, is that the Rayleigh distribution describes the wind speed distribution at an "ideal" location. It provides a reasonable model where the terrain is flat or a plateau and also for offshore wind in locations poleward of the tropics and for upper air soundings at the 850 mb level. It does not provice a good model where the terrain is complex or for urban areas. In these cases, a better solution might be to use a Weibull distribution where the shape factor is in the range 1.2 to 1.8. In these cases, the Rayleigh distribution will over estimate the energy yield.
This is a link to a more detailed description of the Rayleigh Distribution, it will be updated over the next few weeks as other work is completed.
Rayleigh Distribution
Friday, 7 March 2014
Subscribe to:
Post Comments (Atom)


No comments:
Post a Comment