Pages

Showing posts with label environment. Show all posts

Thursday, 10 April 2014

Soil Temperature (A day in the life of)

I've been collecting soil temperatures from my back yard for the better part of two years, normally I do this around sunset on Sunday evening for no better reason than this is usually a pleasant time to sit in the garden and the routine provides some consistency in the data.  The link at the bottom of the page describes the process.

Recently, I found myself in the garden before sunrise (see note below).  This was an opportunity to study the variation in soil temperature during the day.  It was clear  that this could be large, on a spring the morning the ground can have a thin layer of frost and by noon it can be warm to the touch.  The graph below is for a randomly selected day at an arbitrary chosen spot, whilst the absolute values maybe suspect, it does give an indication of their variation.

At sunrise, the sky was more or less free of low cloud and the stars were visible, by noon there was scattered and broken cumulus and a few drops of rain fell but by late evening it was cool and clear again.  The most striking feature of the graph is the variation in the topsoil temperature (0.1m), maybe I missed it's low point, but this could have been 5 or 6 deg. C. by noon it was 16 deg. C, had the clouds been thinner, this might have reached 20 deg. C.  It is this part of the soil where vegetables grow in a thermally turbulent environment.  I am far from being an expert gardener, but I have learnt from the experience of losing seedlings to frost and failure to grow vegetables for winter harvesting that that the choice of crop and the timing of sowing is important.  As the depth of the measurement increases, the variation in temperature with time decreases, at 1.0m the observed range was less than 2 deg. C.

Also on graph is the air temperature from a weather station located approximately 10 km to the west.  I have attempted to collect air temperature data, but shadows from trees, the proximity of walls and our location on the side of an suburban valley make it hard to figure out what is being measured (much the same applies to the soil temperature measurements).  Comparing the soil and air temperature suggests two things.  The first is that whilst there is a correlation between air and soil temperature, the variation of the latter is much greater.  The second is more subtle and this is the complexity of the relationship.  During the morning the ground  warmed and the air followed making it reasonable to assume that there was a relationship between the two events.   However, by late evening, the air temperature started rising even though the ground was subject to radiative cooling.  At this time, the wind which had been blowing gently from the SW all day, veered to the NE, at a guess this slight rise might have been due to advection.

Whilst messing with the soil temperature data, I took the opportunity to update the graphs of Sunday sunset data (it maybe a few days before the website is updated).  The graph for the 1m is shown below:

This graph also contains significant variation.  The winter of 2012/13 was long and cold (maybe not extreme cold, but cold for a long time) which was due to a cold air mass from continental Europe.  Last winter (2013/14) was mild, but marked by wet and windy storms blowing in from the Atlantic.  During January and February the mainstream media was full of pictures of flooding and wind damage, but by April, they were free to return to party political gossip.  This contrast between the two winters is apparent in the soil temperatures, this year they are up to 5 deg. C higher than last year.

Description of the data collection process

This link describes the data collection process and the page is periodically updated with data as it becomes available:

Soil Temperature

Bloggers Note

The drinking habits of my dog are not good.  Whilst he has an adequate supply of clean water he is drawn to ponds, puddles and worse (much, much worse). Normally his digestive system copes with this abuse, but at 04:00 on Tuesday, it failed to do so dramatically.  By 05:00 it was clear that frequent trips to the garden lay ahead, so to offset my irritation and boredom, I set up the soil temperature measuring equipment and produced the graph above.  Should anyone be interested, the dog has made a full recovery and the next rain shower should restore the lawn to its former state..  I am still making up the lost sleep.


Thursday, 12 December 2013

How do you learn about this stuff?

I first became interested in sustainable energy around 2005.  This was before the financial crisis of 2008 when environmental issues were aspirations, not perceived as costs (maybe I exaggerate).  A 2.5 kw rooftop PV installation cost between £15k and £20k and there were no feed-in-tariffs, not surprisingly there were not many to be seen.  DIY superstores were selling 1 kw wind turbines for around £1,500 (I think) and there were stories in the press expressing horror at the low yields, this was not surprising considering that rating was usually for wind speeds around 15 m/s (approx. 30 mph), whilst this is not a gale, its the sort of wind you don't feel too often (for which many of us are grateful).  I struggled to understand this stuff.

Most of my working life I've been lurking in the shadows between technology and economics.  A traditional engineering education did not include economics and the attitude towards its practitioners was illustrated by graffiti  in engineering faculty toilets above the loo roll dispenser which read "Economics degree, please take one".  However, there was an implicit understanding that there should be a link between technical performance and economic benefits, however dubious.

My perception of wind and solar energy systems is that they are conversion devices, the input is "weather" e.g. wind, sunshine, cloud etc. and the output is electricity or heat.  Attempting to understand this relationship has led to the combining bits of wood, drain pipes, Meccano and a sketchy knowledge of electronics into experiments.  I realise now that I must have been a sad disappointment to those burdened with teaching me carpentry, metal work and technical drawing, be grateful that I trained on aircraft engines and did not become a kitchen fitter.

My first attempt around 2007 was the "Solar Bucket", this consisted of three components, a small solar panel, a lead acid battery and several devices to use the energy harvest, the most useful being an early LED light.  The photo shows the panel on a winter's day.


This provided some valuable experience.  It illustrated seasonality, the effects of clouds and much more.  The battery component was originally intended as a measurement device.  I was a little slow to realise it but the battery was the important component, storage is a key element of a sustainable energy economy.  I've heard several people say things like "I want solar panels to make me independent of the energy companies" (or variations n the theme), but the Sun does not shine at night, so without storage they are as dependent on fossil/nuclear fuel as the rest of us.  I argue that investment in energy storage would give a better outcome than more rooftop PV.  As I write this I am staring at more plywood, batteries and wires designed to act as a realistic load for energy management software.

Instructive as the "Solar Bucket" was, it did not act as a resource meter.  This resulted in several attempts at making radiometers.  Initially, these used light dependent resistors and did not work, as these are successfully used in cameras and other devices, the problem was my lack of knowledge.  At some point I purchased a batch of small, flat monocrystalline PV cells for about £1 each and these work well.  The current device could be described as a shaded radiometer and for some reason it attracts the attention of dogs.  The concept is simple, a horizontally mounted cell measures global irradiance, then a shade is placed between the sun and the cell, it then measures diffuse irradiance.  Combine these two measurements with Sun-Earth geometry and you can get an estimate of the direct beam irradiance.

I'm trying to estimate the accuracy of this device, but it suggests that the water content of the atmosphere has has a significant effect on irradiance and particularly diffuse irradiance.  There are some good models of clear sky irradiance, but some of these require data which is not readily available or are related to the climate in which the observations were made, this is an attempt to understand my own back yard.

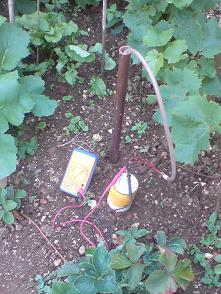
The first radiometer was simply a PV cell shorted with a resistor, the current and therefore the irradiance was measured by measuring the voltage across the resistor with a multimeter.  For several months, I took readings with the cell horizontal with it angled at approximately 50 degrees to the horizontal.  Under a clear sky, pointing the cell in the direction of the Sun increases the output, this maximises the yield of solar devices in summer, but in winter, the English sky is often full of thick stratus cloud, on these days, the output of the PV cell was greatest in the horizontal position.  The object below was constructed to explore this further.


It consists of a light dependent resistor mounted at one end of a length of waste pipe which is mounted so that measurements can be made around the sky's hemisphere.  On an overcast day, the diffuse irradiance was equally distributed about the the sky, whilst on a clear one it was principally from the direction of the Sun.  This suggests that the yield from PV devices in an English winter might be maximised by mounting the panel horizontally.

My home is located on the western side a a valley in an area where the prevailing wind is from the south west, so we are fortunately sheltered from much bad weather.  Whilst solar is a back yard technology, observing the wind means leaving the house.  A lot of wind speed data is collected in clear open space such as airports, offshore buoys and weather balloons.  The data from these sources often relates to the flow of air over a relatively smooth surface and can have little or no relationship with the wind in nearby urban or rural environments.  In these places, the wind eddies around buildings and trees and neither the speed or direction is constant.  In this type of environment, vertical axis wind turbines offer some advantage.  I horizontal axis machine in an urban setting will often "hunt" for the wind, by the time it has aligned itself with the flow, the gust has dissipated.  I was first introduced to the Savonius design by a university friend from the Caribbean, whilst we were taught about marine, automotive and aircraft engines, simple devices for working irrigation pumps got little or no attention.  The Savonius device has two attractive features, the first is that it is not subject to the complex forces seen in other vertical designs, the second is the ease of construction.  In the West Indies they are often made by cutting a 40 gallon oil drum into two, then welding it back together so that it looks something like the model in the photo below.

A few happy days were spent cycling around the city and taking this model to the top of multi-storey car parks, to the end of breakwaters  and occasionally attracting the attention of dogs.  If you are a man wanting to attract women, borrow a puppy, if you want perfect solitude get a model wind turbine.

I did spend some time messing with a dynamometer for the Savonius model, but abandoned it when I realised that I would have little use for the data.  The Meccano tower lingered in my work room reminding me of the value of time.

What have I learnt?  The main lesson is that a sustainable energy economy is complex, its not just a case of shutting down nuclear power stations and seeding the countryside with wind turbines and putting a solar panel on every roof.  Its a blend of realistic expectations, generation, management and storage which is a large technical challenge, but so was developing the technology for nuclear power stations so we've been here before.  Also don't ignore economics, there is a belief held by some well meaning people that sustainability is above economics, one man's feed-in-tariff is another man's economic cost and this does not lead to good decision making.

Its quite possible to do a lot of experiments with limited resources.  The basic rule is to make mistakes cheaply and realise when you are wasting your time.  I put a lot of effort into a solar thermal device, this had a collector area or half a square metre, looked quite impressive but was useless for anything other than drying washing.  A series of small panels each 10 cm square cost very little and were quite instructive.


Friday, 22 November 2013

A Brief History of Walls

Much of the housing in the area in which I live was built in the period 1870 to 1910.  Over the years gaps have appeared and the suburb has expanded to displace sheep from the surrounding farm land.  New houses have appeared on the lawns of grand houses, small orchards, market gardens and in a couple of places the side of a hill.  Whilst the style of building has changed, it is only in recent years that the method of construction has evolved.

The driving forces behind this evolution has been the Building Regulations and a change in the nature of home economics.  Prior to 2000, the general philosophy was to focus on capital costs, fuel for heating which is a major components of a home's operating costs was relatively cheap and a common way of getting a warm home after the arrival of North Sea Gas was to install lots of radiators.  This was not significantly different from the attitude of the Victorians who believed in the health benefits of ventilation and and whose homes needed a good supply of air to keep open fires burning, for them coal was relatively cheap.

Modern houses are built on a completely different principal, they have a higher capital cost but are intended to have much lower operating costs, not only that they are warmer.  The sketch below shows the difference between an old wall and a modern one.  For well over a century, the most houses were built with cavity walls which are just two single brick walls separated by an air gap and the inner wall finished with plaster.

Modern walls are significantly different, the outer layer of bricks might be similar, but the inner wall consists of a layer of foam insulation in front of blocks with good thermal properties and the finishing is insulated plasterboard.  In very rough numerical terms, old walls may have had U value greater than 2.0 watts per metre squared per degree C. whilst that of a modern wall will be less than 0.5.  In non-numerical terms you don't need much heating.  A proud owner of such a building I met recently did describe an alternative to a gas central heating boiler as a form of heating, but that may have been wishful thinking.  The sketches are not from the studying of Building Regulations, but the result of staring into building sites whilst walking my dog.

It is not only the construction of walls which has changed, but doors, windows, roofs.  Double glazing in sealed frames is now the standard and the thermal properties of these are significantly better than a single glazed sash window.

As someone interested in the concept of a "sustainable energy economy", I am sometimes puzzled by focus on energy generation.  I occasionally do a non-scientific survey of the contents of "science and environmental" sections of the media.  The stories range from the bizarre such as "Wind Turbine catches fire in Gale", "Planning permission application for new solar park", "Minister declares offshore wind farm open" and similar.  Only rarely is there an article on conservation or storage.  Its not hard to see why, few journalists or politicians can make much of a house brick, LED light or boiler controls.  Apart from a famous photo of Winston Churchill building a wall, I can't remember any interesting picture of an MP gazing lovingly at a brick.

Postscript

Shortly after I posted this, I heard a news report stating that during the prolonged winter of 2012/13 there had been 30,000 excess deaths (meaning more than normal) and that many of  these were due to old people living in cold homes.  In part, this is due to the way homes were constructed when energy was relatively cheap and plentiful.  Now that this is no longer the case, many homes, especially those of pensioners on low incomes are underheated.  Whilst I don't want to dismiss the value of retro-fitted insulation, in many cases a modest expenditure only makes the house less cold, not warm and does not cut energy bills.  Over a very long period, many thermal disasters will fall down or be demolished, but that will not do much for the generation currently living in them.  It would help if policy makers understood the problem and not ranted on about the imperfect working of the domestic energy market.


Friday, 15 November 2013

Gas Prices - A Family History

I'm peeling away 110 years of interior decorating events in our home's main bedroom. At one point, the floor and walls were dark green, which may have seemed like a good idea at the time.  The locks on the door are were installed by someone with an unhealthy interest in privacy.  Maybe because of these locks, the door was once broken down, I suspect by a jealous lover.  Below the floorboards are three generations of electrical wiring and some plumbing described by a plumbers' merchant as "old school" which may have been installed in the 1970's.  Amongst the filth are the butts of a few "Woodies" and the remains of a fag packet.  The original fireplace was broken up with the skilled use of a 4lb club hammer and the hole blocked up. After a morning of bizarre behaviour I managed to recover a hand painted tile from the debris.  The piping for the original gas lighting appears to be more or less intact, although the fittings have long since disappeared.


There is a subtle harmony in the layout of the room. The bed was positioned to make the most of the early morning sun, the coal fire would have warmed the feet.  The gas lights on either side of the bed are perfectly placed for a book at bed time.  Maybe there was once a dressing table lit by the other gas light where the lady of the house did her makeup and needlework, a hint of her perfume remains.

Electricity was present in the house when it was completed in 1901, not for use as heat or light, but for signalling.  The three main bedrooms had bell pushes which probably connected to an indicator board in what was then the kitchen.  The house is neither large nor grand, but there may have been a live-in cook and this poor woman may have had to provide room service, but she did have the warmest room in the house to work in. The lead-acid batteries which powered this system would have been charged by one of the local shops.

The bedroom illustrates the roles of electricity, gas and coal in the Edwardian energy economy.  More than a century later we use these differently.   Gas is now the principal domestic fuel and its price is increasingly becoming a cause for concern.  The graph of domestic gas price below was compiled from from a collection of family documents:
This graph spans the period from 1928 to 2013.  I am attempting to fill in the gaps, but anecdotal evidence suggests that gas prices fell slowly in real terms during the period 1950 to 2000.

The conversion from money-of-the-day to 2011-money is based on the UK government's Composite Price Index, the attraction of this scheme being the availability of a long time series (one version extends back to 1750).

At the start of the 20th Century, gas was mainly used for lighting.  Coal was the principal domestic fuel for cooking and burning in open fires. The gas came from gas works, often located close to town centres and near a railway line. The economy of gas works was based on a combination of the sale of gas for lighting and coke for heating. By the 1920's gas stoves were rapidly replacing solid fuel ranges.  Simultaneously electricity was displacing gas as the energy source for lighting. Electricity was a much more versatile fuel than gas, it could be used for cooking, lighting, appliances and heating.  The relatively high cost of electricity limited the popularity of electric fires. By 1939, many houses were using electricity for lighting and appliances, gas for cooking and coal or coke for heating.

During the war years, domestic energy consumption declined. Coal was often difficult to obtain, the blackout discouraged the use of lighting and many men and women were away from home either working in the factories, on the land or serving in the forces.  After the war, the availability of energy for domestic consumption increased as war production ceased and the lights were turned on again and houses became warmer.

 In the 1950s, electricity was produced in increasingly larger power stations and distributed by a national grid. Gas was still produced and distributed locally, it was not until large volumes of natural gas were discovered in the Southern North Sea that a national gas distribution network was established.  The North Sea reserves stimulated a "dash-for-gas" and the role of gas in the energy economy changed significantly.

 By 1980 gas had more or less displaced coal as a domestic fuel. This transition was driven by a combination of low cost and convenience.  Anecdotal evidence suggests that domestic heating costs dropped with North Sea gas but there were two other driving forces.  Not least was the ease of  use. Whilst the occasional coal fire is pleasant, heating a house with coal is a labour intensive process requiring coal to be carried, grates to be cleaned and ash to be dumped. Also, for many years fog and smog in urban areas had been a public health problem and the advent of smokeless zones in towns discouraged the burning of coal.

The availability of low cost gas lead to its increased use as fuel for electricity generation.  By the beginning of the 20th century, the UK was ceasing to be self-sufficient in natural gas and imports either by pipeline from Europe or as LNG from the Arabian Gulf and elsewhere have been increasing.  The result of this is that the gas price is now set by international markets.

Friday, 8 November 2013

Soil Temperatures - Update

This is an update of a post published on 02-Aug-2013 which describes the hole in the ground used to collect soil temperatures.  I now have just over a little more than one year's data which makes it possible to look for patterns in the data and do a year-on-year comparison.  I started this project in August 2012 just as the ground was starting to cool after the summer.  The full data set is shown below:
The same general patter is present in the Autumn of 2013 as it was in 2012 with the topsoil cooling more quickly than the sub soil.  The maximum values of topsoil temperature were observed in July when there were several weeks of clear sky when the Sun was high in the sky.  The lows were towards then end of long winter when it was April before Earth and Englishman felt warm in the garden.
So far, weather at the end of Autumn has been milder than in 2012 and the subsoil temperatures are two to three degrees higher than last year.  The topsoil more or less follows the air temperature but, it's variation is increased by radiative heating and cooling can lead to loss or moisture and frost respectively.
The observations from the last month illustrate the complexity of the heating and cooling processes.  During the weekend of 13-Oct,  average air temperatures had fallen to below 10 deg. C (cold air from mainland Europe?) and the topsoil temperature fell below that of the subsoil.  A week later, average air temperature rose to more than 15 degrees (warm air from the Atlantic?) and the situation was reversed, the topsoil was warmer than the subsoil.  In addition to air movements (note to self, try and look at a weather map each day and see what's happening), there would also have been radiative cooling and heating.

After a year, the ritual of poking a wire down a hole in the back yard at dusk on Sundays is well established, data on this web page is periodically updated:

Brighton Webs - Soil Temperature

Friday, 25 October 2013

Energy Storage and Vegas Values

Energy storage is the buffer between supply and demand.  Wind and solar sources are weather dependent systems whilst home and work life tends to follow a more or less predictable routine.  Whilst the ancient mariner or miller might have taken a duvet day when the wind was not blowing, the office worker is expected to be at his/her desk when the weather outside is fair or foul.  Storage is a key component in renewable energy systems.

Monte Carlo simulation is one way to explore the interaction between supply, demand and storage.  The concept is simple, you throw random events as a mathematical model and see how it behaves, whilst this may sound abstract, its more than a bit like real life.  The name was comes from the roulette wheels in the casinos of Monte Carlo in the 19th century, in a fair and decent world, these devices are true random number generators.  If the technique was being named today, it might be called Vegas Values.

The example is based on a simplistic model of a system with three components, a small wind turbine, battery storage and a load. The example has been set up such that the average supply and demand are both 1 kwh.day, however, the distribution of  the supply and demand are different, and it is probable that on any given day, supply and demand will not balance. There could be large demand for energy on a calm day or little demand on a windy one. The inclusion of storage in the form of a battery helps match supply and demand. In this example, we want to understand the effect on system reliability for different amounts of storage.


Over a given 30 day month, the wind turbine produces an average of 1 kwh/day, this supply is assumed to be a triangular distribution with a minimum of 0, a  mode of 0.5 and maximum of 2.5 kwh. This supplies a 100% efficient battery, the capacity of which subject of the simulation. The model was run with storage capacities ranging from zero (no storage) to 10 kwh. The load is also 1 kwh/day and also modelled as a triangular distribution, the minimum, mode and maximum values are 0.5,1.0 and 1.5 respectively. The system "fails"; when the battery cannot supply the load. The parameter of interest is the number of days per month the system fails, which can also be expressed at the probability of the system not failing during the month.

The core of the model is shown in the flow chart:


This is a very simplistic model, so a single function is used to return a triangularly distributed random number, the arguments being the minimum, mode and maximum values. The Python code for this simulation can be found on our website. The principal variable is "storagesize" which is the capacity of the battery in kwh. The output of the program was used to create the graph below.

This simplistic model of a hypothetical system suggests that increasing storage reduces the probability of system failure but at the amount of storage increases, the law of diminishing returns set in.

Related Material

Monte Carlo Simulation

Triangular Distribution

Friday, 16 August 2013

Urban Wind

Munn's third law states that any place you can wear a kilt or a skirt without embarrassment might not be a great place to put a wind turbine.  With this in mind, I spent a few mornings cycling round a seaside town with a simple wind speed meter in an attempt to get an understanding of urban wind.

Until recently the most common source of wind speed data was weather reports from airfields. These are large open spaces and the weather station is usually located somewhere close to the point of touchdown where its data will make the greatest contribution to aircraft safety.  This is in contrast to most residential and commercial areas which are cluttered with buildings, trees and infrastructure such a bridges all of which might be crammed into hillsides and valleys. In the past few years, data from small weather stations mounted in backyards has become available.  The two sources give different impressions, typically, airfields have a average annual wind speed in roughly in the range 4 - 7 m/s, whilst backyards might experience 1 - 4 m/s.  As with all gross generalisations, there are exceptions, but my own backyard sitting on the sheltered side probably has an average of around 1 m/s based on many calm days and a few gusty ones.

Wind speed measurements are typically taken at a standard height of 10m although there are some important exceptions, for offshore buoys it is often 4 - 5 m, for offshore platforms it can be well over 100m (to assist helicopter operations).  Private weather stations can be at any height available to the owner. However, they are generally located at the base of the boundary layer which is not an ideal place to put a wind turbine.  Utility scale machines are mounted on towers, typically 100 metre tall which lift the rotor out of the turbulent and complex air flows found around roof and tree tops.  The photo shows a medium sized wind turbine mounted on a tall tower in an urban location:


However, this type of structure is not practical/acceptable in the average backyard, so wind found at approximately 10 metres is the the resource that is available to most people (subject to neighbours, town planning and building regulations which keep towns and cities safe and relations between residents harmonious).

The plan was to cycle around the town taking wind speed measurements at a variety of locations and compare them to data from a small airfield a few km to the west.  In a failed attempt to introduce an element of street theatre I took a small model of a Savonius wind turbine with me.


Whatever other merits it may possess, the Savonius design can withstand the rough handling that comes from being strapped to the back of a bike.

During seven outings I found about 20 locations where I could take measurements.  With the single exception of a curious dog, this bizarre activity attracted no attention.  The locations included the seafront and a breakwater, the roofs of multi-story car parks and my own backyard.  One days results are shown in graphic form below:

Moderate winds at the airfield are usually smooth and there is a good relationship between the wind there and that experienced on the sea front.  In these places the Savonius model would spin continuously when the wind was greater than 3 m/s.  However, in the town, suburbs and parks the wind was usually attenuated and turbulent, the graphic is a sketch of the relationship between "clear" and "urban" wind:

The rooves of car parks were the most interesting, all five locations were well above surrounding roof tops, yet in all cases, the wind was turbulent and it was rare for the Savonius model to spin continuously.  Having seen several horizontal axis wind turbines in urban locations they often appear to "hunt" for the wind then spin up and down with the gusts.  The vertical axis Savonius was usually quick to respond to gusts, however, the coefficient of performance is low.  The coefficient of performance is the fraction of the wind's energy that the turbine manages to extract.

The relationship between wind speed and power is cubic, thus a 5 m/s wind has almost five times the energy of one of 3 m/s, the relationship is complicated by variations in a turbine's coefficient to performance with wind speed.  In general, the coefficient of performance declines with increasing turbulence.

It is probable that a suburban area with low and widely spaced housing on flat land might give more encouraging results, but in a densely populated English town, small wind turbines have limited potential for generating significant amounts of energy.  The greatest potential for wind energy appears to be large turbines located offshore where average annual wind speeds are significantly higher than those onshore.  However, offshore wind is still a weather/climate dependent energy source.


Friday, 9 August 2013

Negawatts vs, Megawatts

There are two ways to reduce emissions and increase energy  security.  The first is to use less energy and the second is to generate it from renewable sources.  The two approaches are not mutually exclusive and both are desirable but they compete for resources.  Around 2006, I became interested in renewable energy, up to that point, I had not thought too much about consumption and at that time electricity was reasonably priced.  Typical grid-tied, rooftop PV installations produce between 1,500 and 2,500 kwh/year.  A good starting point was to try reduce our consumption to the level at which a form of self-sufficiency could be attained.

Alongside my interest in renewable energy, is a belief that investments which are good for the environment, should also be good for me.  Added to this is the belief that sound investments are based on fundamentals (e.g. fuel savings) and should not be driven by tax regimes or subsidies, In other words, I'm prepared to buy an item which reduces my emissions, but I want to be rewarded in the form of lower energy bills.  For energy consumption, and therefore emissions to fall, there should be a "virtuous circle" by which I use less energy and I am better off as a result.  This should be possible to achieve, energy is now expensive.

Whilst I am fascinated by solar devices and wind turbines, conservation was consistent with my opinions (my favourite coffee mug has the slogan - "everyone's entitled to my opinions").  The graph below shows our household's estimated electricity consumption since 2005:


When we started there were some quick wins, incandescent lamps were replaced by CFLs and old computers which were better room heaters than number crunchers were replaced by laptops.  The gas driven domestic hot water system was an economic mess consisting of a gravity feed system with an efficiency of 20% (a charitable estimate).  This took an average to two hours to create a warm bath, therefore anyone needing to be clean used the immersion heater (cheap at night, but expensive during the day).  The water heating was upgraded to a pumped system which also reduced the gas bill and did not leak.  Rough estimates of the breakdown of consumption "before" and "after" are shown below.


Since 2007, consumption has drifted down to an average of 6 kwh/day, mainly as a result of taking account of energy efficiency as things like fridge have had to be replaced and just being aware of our energy consumption.  We are not wandering around in Stygian darkness obsessed by energy bill dropping through the letterbox.

The law of diminishing returns is beginning to assert itself, we are starting to replace CFL lamps with LED ones which may take us down to 4 kwh/day over the next one or two years.  Our electricity consumption will probably be in the range 1,000 to 1,500 kwh/year, which compares well with the national average of around 3,500 kwh/year (comparing averages is always dangerous).

It has to be said that a wind turbine in the back yard would be fun but as I have embarrassed myself on countless occasions by wandering around the garden with a wind speed meter consistently reading 0 m/s and have no desire to annoy my neighbors, this is not going to happen.  The sun does not shine at night and rarely during winter, so rooftop PV does not appeal.  So, I will press on with the LED lights.

Sadly, conservation is not sexy.  Acquaintances with rooftop PV who have seen me cycling around with a model wind turbine strapped to my back ask me why my south facing roof is empty and an unscientific survey of the environmental pages of the papers (read on my phone) suggests that greater coverage is given to wind farms than to things lurking in cupboards like boilers, heating controls and meters.  A knowledge of the capabilities of smartphones is a sign of virility whilst being able to read gas and electricity meters is considered boring.  Typically, a mobile phone bill is in the range £15 - £30/month, whilst energy bills often exceed £100/month, so there is an incentive to take an interest.

The scale of investment is also an issue, I have the occasional outing to an "eco" fair where a high proportion of the offerings are green boxes with a price tags well over £1,000.  This is not the sort of money that fits well into a typical family budget, yet £10 for an LED light or a few quid extra for a more efficient fridge or washing machine can make a difference over time.

Policies which focus on conservation are difficult for politicians, offering subsidies for generation projects gives an incentive to do something.  Telling people not to do something, i.e. use energy is creates a range of reactions ranging from indifference to to charges of infringing of civil liberties:.


Its better to make a good case for energy efficient lighting than embarking on legislation which does not win hearts and minds.  Had we not adopted CFL's are electricity bill would now be approaching £100/month.

The link between environmental benefits and high cost objects also seems to be well established in (some) political thought processes.  During the 2010 election I was accosted by a canvasser keen to establish the environmental credentials of their chosen candidate, in the interests of fairness, it is probable that I was being a pain at the time, but the patter went along the lines "Of course she can't afford a Hybrid Car". My understanding of hybrid vehicles is that by combining a petrol/diesel engine, motor/generator and a battery you can make a fairly efficient vehicle for £27,000, however, some conventional vehicles, often described as "dull" by reviewers, offer similar performance for much less.  Other options include a small car, no car and a bicycle.  If you live in a remote rural area, you need a car, if you live in a city, a bicycle makes sense economically and environmentally, that also seems to be the view of the current Mayor of London, the man behind the Boris Bike.

Next week - Urban Wind


Friday, 2 August 2013

Soil Temperature

Last year, I became curious to know why there was such a wide variation in the time to germination of seeds (mainly beetroot).  Sowing things at the earliest date suggested by the directions on the packet seemed like a good way to maximise yields, however, some seeds took a month to germinate with a low success rate, whilst the same variety planted in late July germinated quickly with a high success rate.  One explanation was variation in soil temperature, even in England, the ground is warmer in July than it is in March.  To try and understand what was happening, I started measuring soil temperatures approximately an hour before sunset on Sunday evenings.  This post is a celebration of a year's data collection and the politeness of my neighbours.

This web page is periodically updated with data as it becomes available:

Brighton Webs - Soil Temperature

The first step was to sink a length of copper pipe into the ground, the only consideration about its location was the hope that the house's water supply was located somewhere else.  The base of the pipe extends a few centimetres into the chalk which is the dominant feature of the landscape in these parts.


Temperature measurements are taken by lowering a 4.7k thermistor mounted on the end of a 2 metre length of neoprene tubing.  A baffle on the end of the tube is meant to limit the movement of air in the hole to ensure that the measurement is related to the pipe, not the air within it.  The resistance of the thermistor is taken with a basic and much abused multimeter.


The photo shows the equipment in use, data logging is done with a pencil and paper.

The results to date are plotted on the graph below together with the average air temperature for Brighton.

The graph clearly shows the wide variations in temperature experienced by the topsoil.  In winter radiative cooling on a clear night can take the topsoil temperature several degrees below the air temperature whilst a hot sunny day with a clear sky can raise it several degrees above it.  The thermal environment of vegetables is much more turbulent than one would suppose from simply looking at the air temperature from a weather report.  Some gardeners will have experienced the damage done by overnight frost and discovered this on a warm spring morning.

In contrast to the topsoil, the subsoil temperature closely follows the average air temperature.  The relationship between the topsoil and subsoil temperatures is interesting, when the ground is cooling after the Summer Solstice, the subsoil is warmer than the topsoil.  After the winter solstice, the subsoil takes a few weeks to start warming.  It is as though the subsoil is acting like a storage heater, keeping the soil warm as Autumn and Winter approach.  I was intrigued by this, the graph below shows a simulation of the solar irradiance received by the earth's surface and the average air temperature.  Solar irradiance peaks at the Summer Solstice in June and is at a minimum at the Winter Solstice in December, yet the warmest month is July and the coldest one is January
Whilst solar insolation and radiative cooling account for a large part of the temperature variation experienced by the topsoil, advection is also significant.  From January to April 2012, cold air masses moved across the Channel from Continental Europe, these acted to suppress the soil temperate, making it difficult for seeds to germinate, it was May before the topsoil temperature got above 10 deg. C.

Climate classification schemes as Koppen are based on the concept that native plants have adapted to the prevailing temperature and rainfall.  In 1954 Dorothy Hartley published "Food in England", this was before the worldwide movement of fruit and vegetables.  In the 1950s, market gardens could found on the edges of big town, also many people had been involved in part time vegetable cultivation during the war and had continued to do so in their back gardens.  Some of the varieties described by Harley had been bought to England form overseas, the best known example being the potato which is thought to have originated some around Peru or Bolivia, but all of them had been grown here for at least a hundred years.  A common characteristic of most of the plants grown from seed is that they will germinate in temperatures of less than 10 deg. C..