Pages

Showing posts with label clouds. Show all posts

Friday, 10 May 2019

Clouds and Irradiance from the sky


This was quick-and-simple study to look at the distribution of solar irradiance under a cloud sky.  The intention was to get some insight into the mounting of solar panels.  Under a clear sky, the greatest output is obtained by pointing them at the Sun.  For fixed mountings the optimum is facing south at an angle to the ground close to the latitude of the equipment.  This may not be the case under a cloud sky where the direct beam irradiance is attenuated and a higher proportion of the total is diffuse from the hemisphere of the sky.

The equipment was constructed from materials to hand which included a length of waste pipe, part of a broken bed and a roll of packing tape.  The main component was a light dependent resistor mounted at the base of a 300 mm length of white waste pipe whose translucence was reduced with a wrapping of parcel tape. The photo shows it in position sitting on top of a dust bin.


Operation consisted of setting the altitude to 15, 30, 45, 60 or 75 degrees, then rotating the instrument from 0 to 330 degrees in 30 degree increments and recording the resistance of the light dependent resistor.

The light dependent resistor has typical resistance of 20k at 100 lux. A simple calibration gave the relationship between resistance an luminescence of:


The results should be treated as relative irradiance which are consistent for the experiment, but are unlikely to represent accurate absolute values.

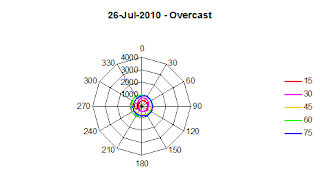
Overcast Sky - 26-Jul-2010 15:00: The irradiance increased slightly with altitude, but was relatively constant with azimuth.  The cloud was thick and low, there was a small break to the northeast, hence the higher irradiance in that direction:


The conclusion drawn from this observation is that irradiance from an overcast sky is more or less uniformly distributed around the sky, albeit at a level much attenuated from that expected under clear sky conditions.

Broken Cloud - 27-Jul-2010 14:00:  The early afternoon sky consisted of broken cloud, with the sun 
occasionally visible through the cloud.  Compared to the overcast sky the day before, there was significantly greater irradiance in the part of the sky in which the Sun was located.


Typically, in our part of the world, cloud described as broken, is a discrete layer and can sometimes have similar appearance to an overcast sky with only occasional glimpses of the blue sky above. This was the case on the day these readings were taken. There is an increase in irradiance in the direction of the Sun, but a significant amount of irradiance is coming from the sky as a whole.

Few Clouds - 28-Jul-2010 11:30:  As so often happens when there are a few clouds in the sky, there was some fluctuation in the readings. The maximum irradiance was to the south east at an elevation of 45 to 60 degrees.

The irradiance under a sky with a few clouds is similar to that of a clear sky with exception that there may be short periods of attenuation.

Clear Sky - 16-Aug-2010 15:00 - The irradiance is clearly coming from the sun's disk:


Under a clear sky the maximum irradiance received by a device is when it is pointing directly at the Sun. In this case the maximum irradiance was around 230 degrees at an altitude of 45 degrees which is close to the altitude and azimuth predicted by Sun-Earth geometry.
Thursday, 2 April 2015

The Signature of Clouds

Experience with a 4.5 watt solar panel in 2009 showed that clouds were a significant factor in the energy yield of the device.  Under a clear, summer sky the panel might generate a current of 300mA at noon, under an overcast sky in the same month, this would drop to less than 50mA.  My first attempt at understanding the attenuating effects of clouds was to sit in the backyard with a flat photodiode and a multimeter and watch the output change as clouds passed overhead.  Later I found some datasets which allowed some form of statistical analysis, whilst these have been instructive, there is a lot to be learnt from simply staring at the sky.  Whilst the objective was to suggest some form of model which related observed cloud cover to the attenuating effect of clouds, the variations in the meter readings suggested that cloud types have distinctive signatures.  This post is based on some hand sketched graphs based on staring at a digital multimeter.  I have recently acquired a Raspberry Pi and an interesting project would be to explore this concept further using the Pi to record images of the sky and the output of a photodiode.  One day...............


One way of describing the attenuating effect of clouds is the Clear Sky Fraction which is defined as:


Clear sky irradiance is constantly changing, it is close to zero at sunrise and sunset and peaks at solar noon, the attraction of this ratio is that it is independent of sun-earth geometry.  Experience suggests that it is more or less independent of air mass for values in the range 1 to 6.  Under a perfect clear sky, CSF is close to 1.0.

Samples of CSF for a given cloud base and extent (excluding an overcast sky) will form a bimodal distribution, but the nature of short time series may indicate the type of cloud. The graphics below are sketches based on manual observation, rather than a comprehensive analysis from the output of a data logger, thus they should be treated with caution.

Cumulus is a common feature of an English summer sky, typically the CSF varies between 0.4 and 1.1.  CSF values greater than 1.0 occur when the edge of a cloud pass passes across the sun's rays causing a short period of increased diffuse irradiance.  The ratio of the duration of high and low periods depends on the extent of the cloud.

In winter, the sky is typically overcast with a thick layer of stratus, then the CSF is generally in the range 0.2 to 0.4 with only small random fluctuations.

 High level cloud, such as cirrus,  has a much less attenuating effect than types such as cumulus,

These sketches are the result of observations from a sky with only a single layer of cloud.  The author's experience suggests that as the number, extent and complexity of the cloud layers increases, the values of CSF tend to behave like an overcast sky, thus a complex sky might not fit these somewhat idealized patterns.


Saturday, 19 April 2014

Sloping Off


The clear sky performance of solar devices is reasonably easy to predict.  Man has had a good working knowledge of sun-earth geometry since the dawn of time and until scientists starting messing with decaying atoms, the sun was time.  The equations may have gained some extra terms and decimal places, but an understanding of the principles is apparent in England's Stonehenge, Mayan Temples and many other ancient world heritage sites and sundials.  Over the past few weeks I have been attempting to clean up our "Simple Clear Sky" model.  This small lump of Python code trades accuracy for simplicity, my research interest in the the effect of clouds on solar devices, whilst a solar irradiance under a clear sky follows a smooth curve, soon as a cloud gets between the sun and the earth, the curve looks like the teeth of a halloween lantern, so high accuracy is not that important.  There will be more on this model in a later post.  The code clean-up is part of a large decluttering of spreadsheets and code fragments.

When I first became interested in wind and solar energy resources, I attempted to educate myself with crude wooden constructions in the backyard.  Having gathered the photos together, I realise must have caused my neighbours some embarrassment.  Having amassed some photographic evidence of things I wish I had never started, I have none for experiments which were vaguely useful.  One of these was a 1.5 watt amorphous PV panel which was south facing, but the angle relative to the ground could be varied from zero to ninety degrees.  The objective was to see how the output of a solar panel changed with slope under an overcast sky.  A summary of the results is shown in the graph below:

There are two sets of data, one for a clear day and the other for low overcast skies.  The clear sky curve has a maxima somewhere around 50 degrees.  A reasonable estimate of the clear sky results could have been made by the Python model.  The curves of the overcast sky are more interesting.  First they "peak" when the panel is horizontal, suggesting that the irradiance is more or less evenly distributed over the hemisphere of the sky, secondly, the relationship between slope and irradiance could be approximated by a linear relationship.

Whilst my backyard is generally sheltered from the wind, a stray gust ended this experiment, the mountings of which were later used as firewood.

Later this year, I hope to have a small 20 - 30 watt solar installation working in the back yard, which hopefully will have some data logging capability which will allow a cloud sky model to be firmed-up.


Friday, 4 April 2014

Solar Energy in Winter

Solar PV is the most accessible of the sustainable technologies.  Unlike wind turbines which are relatively expensive and require carefully selected locations to be effective, solar panels are relatively cheap and can be located in backyards, fields and roofs.  The downside of solar PV is that it does not work well in an English winter and not at all at night.

Under a clear sky, the ideal mounting for a PV panel is on a tracker device which keeps it pointed at the sun, however, this type of device is expensive and a common solution is to place them on a south facing frame tilted according the latitude of the installation.  This approach will maximise the yield over the period of a year allowing the panel to take advantage of the clear or sparsely clouded skies of summer.

Treat the comments below with caution as they are based on two experiments using  basic measuring devices and I have not yet hat the opportunity to test the ideas with a PV panel.  The hypothesis is that the yield of a PV panel may by higher in winter if it is mounted horizontally.  I'm contemplating some further work for next winter with a project which attempts to maximise the use of wind and solar power, but at the time of writing, no decision has been made.

The first experiment was conducted in 2010.  The equipment was crude, it consisted of a light dependent resistor (LDR) mounted at one end of a short length of waste pipe, this was mounted on some woodwork which allowed it to take readings around the hemisphere of the sky.  The calibration of the LDR was in Lux and whilst this was not ideal, the objective was to observe relative intensities, so units were not too important.


On occasional trips to the Science Museum, I'm inspired by the well crafted instruments and the neatly written notebooks of observations.  These are things I aspire to, this particular device was used as firewood after it had produced a few graphs.  The link below gives a slightly more detailed description of the exercise, but the graphics below show the extremes.

The first graph shows measurements made under a clear sky.

Obviously, the maximum irradiance is mainly direct and at a maximum in the direction of the sun.  Under an overcast sky, this is not the case.


In this case, the irradiance is diffuse and more or less evenly distributed around the hemisphere, albeit at a much lower intensity than under a clear sky.

The second experiment took place during the winter of 2010/11.  The equipment used was the first attempt at a solar radiometer.  Whilst the device did produce some informative data, it also taught the lesson that simplicity, reliability and repeatability should be the design objectives.  The procedure was stand in the back yard with the improvised radiometer around noon and take two observations, the first with the instrument in the horizontal position, then with it inclined to the same angle as the pitch of our roof.  The absolute magnitude of the irradiance was probably dubious, but the presented as ratios is informative.  The graph shows the distribution of the ratio of the irradiance of the horizontal surface to that of the sloped one broken down by cloud cover.


The results show two peaks.  the left one in the colours of a clear or moderately clouded sky shows that the irradiance of the horizontal surface is less than the sloped one.  More interestingly, this is reversed under an overcast sky in which case the irradiance of the horizontal surface is greater, albeit at a much lower level.

One of the challenges of sustainable energy is managing seasonal variation.  In the case of solar energy, the irradiance is determined by sun-earth geometry with the clear sky irradiance in January being less than 20% of that in July and the increased frequency of overcast skies in winter reduces this still further.  Horizontal mounting might increase the winter yield, but by how much is not clear.  I am currently working on a cloud sky computer model which might allow the concept to be explored.


Friday, 21 March 2014

Clouds and Irradiance - A Simple Model


Simulating the performance of a solar energy system requires a model for solar irradiance.  Solar irradiance is a function of Sun-Earth geometry and atmospheric conditions of which cloud cover is the most significant.  On a typical summer day in the south of England  there will be a few or scattered cumulus clouds which might reduce the global horizontal irradiance to 80% of its clear sky level, whilst in winter a thick layer of stratus can reduce this to 10 - 20%.

As with everything else on this blog, this is unreviewed work-in-progress and should be treated with caution.  This is post is a simplified description of a project, it is planned to compile a more detailed account of the work at a later date.

The basis of the model is the attenuation of clear sky irradiance caused by the presence of clouds, this is described by a variable called the clear sky factor (CSF) which is defined as:


The graph below was compiled from data collected around noon in June 2011 illustrates the variation in CSF with cloud cover.  for the clear sky it constant at 1.00, for overcast conditions it is more or less constant at approximately 0.15.  On a day of scattered cumulus cloud the CSF fluctuated widely, the low levels recorded when the cloud passed between the measuring device and the sun, the CSF was close to that of the overcast sky, during the period of transition between cloud and clear sky, the CSF exceeded 1.0 due to an increase in diffuse irradiance, this might be called the cloud fringe effect. 


For air mass values in the range 1.2 to 6.0, CSF appears to be more or less independent of air mass which is allows a model of solar irradiance to be based simply on an estimate of clear sky irradiance and a description of the cloud cover.

GHI was chosen as a measure of irradiance because it is the most commonly collected form of irradiance data.  A basic measuring device is simply a small horizontally mounted PV cell.  Clear sky irradiance is influenced by factors such a aerosols and water vapour, whilst there are some excellent models which take these into account, for most locations little is known about the state of the atmosphere at a specific time, especially when clouds are present in the sky.  After some experimentation, a correlation developed by the Meinells which requires only air mass as an input was found to produce a reasonable estimate of Direct Normal Irradiance (DNI).  GHI is a combination of direct normal irradiance and diffuse horizontal irradiance (DHI), as no equivalent formula to the Meinell one could be found for diffuse irradiance, one was derived from local observations using a simple shaded radiometer, this latter formula is subject to revision as more data becomes available.

In the south of England, the "economic" range of air mass is approximately 1.2 to 6.0, for these values the plane parallel formula for Air Mass produces a workable estimate and offers some computational convenience.  This simplification may not be appropriate for regions such as Arizona where there is significant DNI at much higher values of air mass.

The formulas used for the estimated clear sky GHI are:


The most readily available source of cloud cover, apart from looking upwards to the sky, is the METAR reports used in aviation.  These include a description of the sky, if one or more layers of cloud are present, there will be a description of its base height and extent, e.g. SCT040 means scattered cloud at 4,000 feet.  A basic description of the extents is is shown below:
  • FEW - up to 2 octas
  • SCaTtered - 3 - 4 octas
  • BroKeN - 5 - 7 octas
  • OVerCast - 8 octas, no blue sky visible
The widespread use of these description made them a logical choice for use as the basis of a model.

One way of creating a model it use distributions of CSF for a given cloud extent.  The graphs below are summaries of the effect of low cloud (less than 6,000 feet) in a maritime temperate climate, also known as Sussex of Cfb in the Koppen system of climate classification.  The distributions for few, scattered and broken cloud are typically bimodal.  the low mode describes the CSF when the sun is obscured by cloud and the high mode is the interval of clear sky between the passage of clouds.

When there are only a few clouds in the sky, the average value of CSF is around 0.8 and there is a greater probability of high values of CSF (i.e. the overall attenuation is small).


As the extent of the cloud increases, the average value of CSF falls for scattered clouds and the probability of CSF being either high or low is approximately equal.  This is consistent with the definition of scattered cloud which is that up to half the sky contains cloud.

 Part of the definition of broken cloud is that there is at least some blue sky visible even though most of the sky is full of cloud, this is reflected in the summary graph.

There is no blue sky visible under an overcast sky and the distribution is unimodal and the mean is low.
These summaries are over  simplifications designed to allow a simple model.  Other factors which are important are the height of the equivalent summaries  cloud, high cloud are significantly different and the values of CSF much greater.  The model as currently configured, simply takes the highest, and most dense layer, which effectively assumes a simple sky, often the sky is complex, especially during the passage of fronts.  Part of the work in progress is to determine the variation in attenuation between climates, for example the nature of solar irradiance in the desert regions of Arizona, are significantly different from those on the south coast of England.