Pages

Friday, 28 February 2014

Clouds and Irradiance

Comment

This was written over a year ago to gather together thoughts and observations on the relationship between clouds and solar devices.  It has not been formally reviewed, thus it should be treated with caution and as a discussion.

Solar Devices

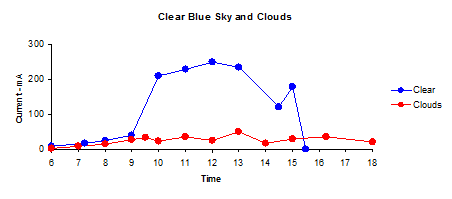
The output of a solar device is determined by Sun-Earth geometry and the state of the sky between it and the Sun.  The effect of clouds can be significant, a patch of low cloud passing between the Sun and a PV panel on a clear day results in an instantaneous drop in the current supplied by the panel.  Low, dense cloud which persists for several days can reduce the output of a solar panel by more than 80%, even during the summer months.   The two graphs show the effect of cloud cover, they are based on observations made a few days apart in May 2008, the first set of readings were made on a clear sunny day, the second were taken during a period of low cloud which persisted for three days.  In both cases, the load on the panel was a lead acid battery which was almost fully discharged at the start of day.  On the sunny day, the battery was fully charged by 15:30, on the cloudy day, the charge was no more than 25% of the battery's capacity (crude estimate).

The first graph shows the current delivered to the battery between 06:00 and 18:00:
The second shows the charge supplied to the battery (in mA hours):

The "clear" and "clouds" represent the extreme cases, most days are a mix of blue sky and passing clouds.

On days when the sky state consists of a few, scattered or broken clouds there will be significant fluctuations in irradiance within a short space of time (and hence output) as can be seen in the graph below:


At the time these measurements were recorded, scattered cloud was present at an estimated height of 2 - 4,000 feet.

The Sky over Southern England


The bubble chart shows the states of the sky over southern England during a year:


The graphic does not give a full description of the sky.  In summer the low cloud is typically a thin layer of cumulus which has only a moderate attenuating effect whilst in winter, the sky is overcast with a thick layer of stratus.

Summer
Winter
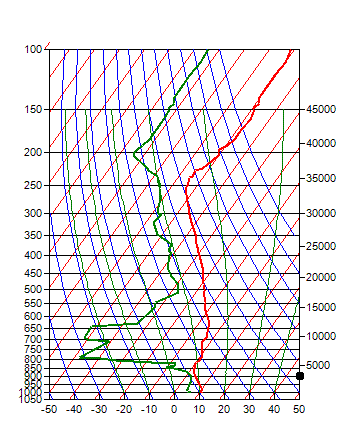
The skewT diagrams which show the temperature and dew point data collected by a balloon rising through the atmosphere might look like this:

Summer
Winter
SkewT diagrams are complex, but a lot of information can be obtained visually.  When the temperature and dew point lines are far apart, the relative humidity is low, as is the proability of cloud formation, when they are close together, the relative humidity is high and it is probable that clouds have formed.  In the left hand diagram, the cloud is probably a thin layer of cumulus as shown in the photo above.  In winter, the high relative humidity resulting from lower temperatures may allow can allow a thick layer of cloud to form.  

Solar devices and the human body generally don't make too much distinction between a clear blue sky and one with a few clouds in it, but a thick overcast layer can reduce the amount of solar radiation reaching the Earth's surface by more than 80%.  This can reduce the output of solar devices and creates a desire in the English to move closer to the Equator.

What Clouds Do

The effect of clouds is to reduce the amount of the Sun's radiant energy transmitted to the Earth's surface.  Part of the energy is reflected upwards and part of it is absorbed within the cloud itself.  This is illustrated in the diagram below:

Add caption
The cloud also changes the nature of the irradiance.  The cloud acts as a diffuser, when the Sun is obscured by a cloud, the irradiance is not only attenuated, but becomes diffuse.

The proportion of energy transmitted is a function (amongst other things) of the type of cloud, its height and thickness, the nature and extent of the cover and the time of day.  All of which conspire to make it difficult, if not impossible to model the process.

The Seasons

Whilst the attenuating effect of clouds is a combination of reflection and absorption, there does seem to be a link between the thickness of a cloud layer and its attenuating effect.  In winter, the base of low level cloud falls and the thickness increases as does the zenith angle. The graph below was inferred from data collected by the Electric Solar Bucket in the South of England.

It shows that effect of clouds during winter is much greater than during the summer months.

Describing the effect of Clouds

There are many ways of describing the effect of clouds.  Most of the comments on this site are based on the Clear Sky Factor (CSF for short), This is the ratio of the observed global horizontal iraddiance (OGH) to estimated clear sky global horizontal irradiance:


Under a clear sky, the value of CSF is constant at 1.00, under a thick, overcast sky it is usually in the range 0.1 to 0.2

The choice of GHI as a basis for a ratio is pragmatic, GHI is the most readily available form of solar irradiance data and secondly it is relatively independent of device geometry.

The second measure is the diffuse fraction which is the ratio of diffuse irradiance to total irradiance:


Under a clear sky, the diffuse fraction is typically around 0.15 whilst under an overcast sky is constant at 1.00

The effect of increasing extent

The diagrams below show how CSF and DF change with the state of the sky.  These diagrams are idealised, even a casual glance at a clouded sky suggests that there is strong random element in the behaviour of clouds and for this reason it might be desirable to model CSF and DF as probability distributions.

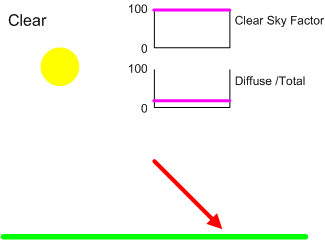
Clear Sky


Under Pure Clear Sky conditions, there is no attenuation, the value of CSF is 1.00 and the diffuse fraction in the range 0.05 – 0.15.

Overcast Sky


At the other extreme, the modal value of CSF for a thick overcast sky is around 0.2 with a relatively narrow variation, say in the range 0.1 to 0.3.  No direct sunlight reaches the ground and the diffuse fraction is constant at 1.00


The Cloudy Sky

The cloudy Sky is an intermediate state between clear and overcast.  A common scenario is for cloud masses to move across the sky propelled by wind.  When a sensor on the ground sees clear sky, the instantaneous value of CSF is around one and the diffuse fraction will be greater than under a clear sky.  It is possible in the case of FEW clouds or high level clouds that CSF will exceed one due to the additional diffuse irradiance. When the Sun is obscured by cloud, there will be little or no direct irradiance and the diffuse fraction will approach one.  Over a time interval, say 15 minutes, the time average of CSF will be proportional to the amount of cloud cover.


Precipitation and Obscuration

Rain, snow and fog are frequently associated with low, dense cloud, added to which is a layer of large droplets of liquid water.  The effect, depending on the intensity of the weather is to lower the value of CSF below that expected from overcast cloud, sometimes to around 0.05.


A special case of the effects of weather on solar devices is when the receiving surface becomes covered in snow, in this case the CSF falls to zero, even though pure clear sky conditions may prevail.

The effect of Height


Cloud types are divided into three groups, low, medium and high.  Low clouds are those between ground level and 6,000 feet, their formation is influenced by conditions on the ground.  High clouds exist above 18,000 feet and are composed of ice crystals.  It is less common for medium level clouds to exist as a single layer, they are often part of a complex sky during periods of changeable weather.

Weather reports usually only provide information on the extent of the cloud and the height of the base above ground and sometimes the type (e.g. cumulus, cirrus etc.), they do not describe the thickness.  The thickness can be a function of the climate type and season, for example, the description OVC020 (overcast with the base at 2,000 feet) might describe a thin layer of stratocumulus in in a Californian summer or a thick layer of nimbostratus during a European winter.  Also as the extent of the lower layer increases, less is known about the layers above, thus in the example above, there could be several layers of cloud above the overcast at 2,000 feet.  The comments on are based on observations of single layers of cloud and because of the issues outlines above, should be treated as generalisations.  As the complexity of the sky increases, conditions become overcast.

Low cloud has the greatest attenuating effect.  Skies described as having a single layer of  few, scattered or broken cloud typically have CSF values in the range 0.4 to 0.6 when the sun is obscured by cloud.  The length of the period of obscuration increases as as the extent increases.  As the extent becomes overcast the range of CSF values  can extend from 0.6 right down to less than 0.1. The lower values being associated with thick layers of stratus or nimbostratus often with bases around 1,000 feet.

In most cases, high clouds such as cirrus have a relatively small attenuating effect ,an overcast sky of high level cloud might might have a CSF value of 0.8.

Friday, 21 February 2014

Mill Hill - The clue is in the name

I live on the west side of a densely populated valley in part of the country where the prevailing wind is from the south west.  Occasionally, a family living on the floor of the valley embellishes a family celebration with helium filled party balloons and inevitably a few break loose from tiny hands and escape.  Usually, their freedom is short lived as they get caught up in the surrounding trees but sometimes, especially on a calm day, one ascends vertically.  At some height, maybe, 100m, the balloon heads off to the east.

You can learn a lot about solar irradiance from one's own backyard, but studying the wind means leaving the house.  From watching lost toy balloons, hot air balloons that I hope were not lost, walking and cycling around the town and countryside with a wind speed meter and looking at data from personal weather stations, I have formed the hypothesis that wind flows reasonably steadily of over hills and humps but is attenuated and gusty in the dips in between.  If wind blows up a valley, there can be a funnelling effect in which case the valley ceases to be a place of shelter.  In other words wind does not always flow parallel to the surface.  As always, these comments should be treated with caution as other conclusions maybe possible with wider experience and greater knowledge.


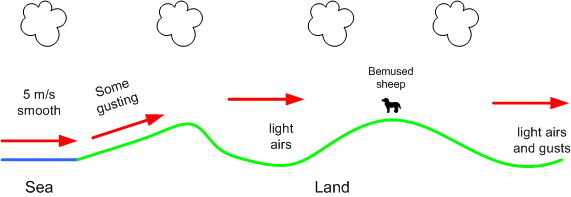
On 21-Sep-2013, I walked along a ridge from which there was a sea view, then dipped into a valley, as I walked along the path that lead to the next ridge I encountered a bemused sheep which continued to graze whilst I messed with a wind speed meter. Beyond this second ridge is an inland plain.  On the seafront, the wind was blowing steadily at 5 m/s from the south west.  The sketch below is an interpretation of the wind speed measurements I took along the way.  On the slope up from the sea the wind blew steadily with some gusting as it did on the two ridge tops.  In the valley, the air was still, with little movement in the tree tops.  On the plain, there were some light gusts of wind.  The red arrows suggest the path of the wind.


I recently wrote a small programme to draw contour lines using SRTM data.  Whilst this was written for some other purpose, I have used it to plot the terrain around a random selection of windmills (the sample size was 14) identified from Wikipedia.  A little reading around the subject suggested that location of many mills is named "Mill Hill" (obvious with hindsight).  If you Google "Mill Hill" you wind find a diverse list of places around the UK.  Not all windmills are located on ridges and hills, but it is a favoured location.  The graphic below shows a typical windmill location in a hilly region, the red contours are the high ground and the blue ones are the surrounding low lying area.


One source of wind data is aviation weather reports (Metars).  It was whilst looking at the terrain on which airfields were located, it appeared that some which were laid out in the 1920's and 1930's are located on plateaus, like the one shown below.  This observation is from a very small sample but may have some logic.  A favourable wind would help getting a heavily laden and by today's standards, under powered aircraft off the ground


And my point is?  The number of onshore locations where a wind turbine can be usefully be placed is constrained by terrain.  This is further influenced by accessibility (almost everywhere belongs to someone) and acceptable land use.

Friday, 14 February 2014

Wind - Going off at a tangent

When I first became interested in the contribution wind and solar energy could make to a sustainable energy economy, a good starting point seemed to get an understanding of the energy available for conversion into heat or electricity.  There is a lot of good wind data available in the public domain, so I started plotting out out wind speed distribution diagrams like to one below for a randomly selected group of worldwide locations.

As is the way with these things, one question leads to several more.  The first concerned the sample.  Most "good" data is collected not amuse spreadsheet addicts, but to assist the safe passage of ships and aeroplanes which tend to operate from open, uncluttered spaces and often produce neat and tidy datasets which can be modelled with the Rayleigh or Weibull distribution (the Rayleigh distribution is a special case of the Weibull distribution in which the shape factor is constant at 2.0).  Even without attracting attention to oneself by cycling around with a wind speed meter, it became clear that the wind speed distribution in places like backyards and some other parts of the urban and rural landscape where more complex.


Terrain is a factor in determining the amount of wind energy available at a given location.  The average wind speed and distribution will be different at the floor of a valley from that at the ridges either side.  These comments are drawn from work in progress from which as yet no definite conclusion as been drawn, thus they should be treated with caution.  In general, offshore wind polewards of the tropics has a higher average speed than onshore and approximates to a Weibull distribution with a shape factor of 2.0.  Onshore at a similar latitude, the average wind speed is lower than offshore and its distribution more skewed to the left, in terms of the Weibull distribution, the shape factor is often in the range 1.3 to 1.8, the higher values being associated with flat, open areas.

In an attempt to explore the effects of terrain on the distribution of wind speed, I plotted small contour maps using data from the SRTM mission, like the one shown below which is centred on a windmill close to where I live..


I've had to put this work to one side for a few months, but not being the most disciplined of researchers, I wondered if the software used for the contour plots could be used to give an insight into the location of windmills.  In reality, this was going off at a tangent, but the logic was that windmills are found in places for which there is no readily available source of wind speed data, thus studying their location would be an interesting way of looking at terrain and wind, this work has also been moved to one side, but I am looking forward to returning to it.


Wikipedia has some excellent lists of windmills from around the United Kingdom, and in may cases does the tedious task of converting National Grid coordinates to lat/lng relative to the WGS84 datum which are compatible with the SRTM data.

Windmills are part of the English landscape, especially in the eastern counties, but I was surprised at the number of them, maybe 2,000 (a guess) with the majority being built and operated in the 19th Century.  At the beginning of the 20th century, the windmills were displaced by factories powered by steam, oil  or electricity.  For there to be so many windmills in operation, there must have been a substantial industry dedicated to their construction and maintenance together with a knowledge of the relationship between terrain an wind energy, I would be curious to know if there was a reference work on this?

In a week in which the UK has been lashed by some of the most violent storms in living memory, it should be remembered that the wind machinery has to survive under considerably harsher conditions than it normally operates.  In storm conditions, wind turbines shut down in an attempt to minimize the risk of damage.


Friday, 17 January 2014

Diffuse Solar Iradiance

There are several models which can provide a good estimate of the solar radiation received by a surface, one of the simplest is the Meinel model which relates direct beam radiation to air mass.  This formula is based on observations made in the Mojave Desert in the 1960's.  Whilst it does not take into account atmospheric conditions such as water vapour and aerosols (minute particles resulting from many human and natural processes) for which data is not always readily available, it provides a reasonable estimate of direct bean, clear sky solar radiation.  The diffuse radiation is often estimated as a fraction of the direct beam radiation, often a figure between 10 and 15% is quoted.  However, it became clear when looking at data from a variety of sources, that the diffuse fraction increases as air mass increases.  Clear sky diffuse irradiance is inversely proportional to air mass in the same way that direct beam irradiance is, but the rate of decline is slower, hence the increase in diffuse fraction.


 This project is an attempt to produce a simple model for diffuse irradiance in southern England.

Comment

This is work in progress and has not be reviewed and should be treated with caution, It is an update on earlier one entitled "Then Diffuse Fraction" which has been deleted.

The Equipment


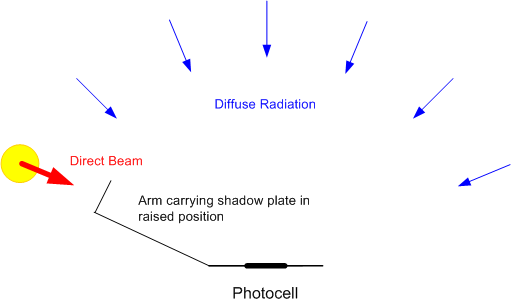
The equipment consists of a flat photocell mounted on a horizontal surface.  This photocell has good cosine response.  The short circuit current of the photocell is directly proportional to the irradiance, in this case the short circuit is provided by a 10 watt 1 ohm resistor, the voltage across indicates the current through the cell.  An arm mounted in front of the cell carries a shadow plate.  When this arm is raised, the photocell is in shadow and only receives diffuse radiation, when it is lowered, the photocell receives both diffuse and direct radiation.  The concept is shown in the diagram below:


The device is constructed from Meccano and plywood.  Three screws provide a means of obtaining a horizontal surface as indicated by a level gauge.The photo shows equipment in use.


Originally, the equipment was meant to be a prototype for something better, however, as data has accumulated, I am reluctant to make changes and introduce inconsistencies into the data.  One useful enhancement would be to put an amplifier into the circuit to increase the precision of the measurements which is currently limited by capabilities of the multimeter.

Observations

Data is collected on days when a large part of the sky is clear, such days are rare in the south of England and accumulating a workable dataset is proving to be a slow process.  Ideally, the analysis should be based on a full year's data, at the time of writing, there is only eight months from May 2013 to December 2013.

Observations have been made in a number of locations.  For air mass values in the range 1.5 to 4.0 (mid morning to mid afternoon), the data appears to be similar for any open space, such as a public park ringed with trees.  For higher values of air mass (around dawn and dusk), it is preferable to cycle to a south facing beach.

Dogs

One of the hazards of collecting data in public places is the attention of dogs, I like dogs, so this is not a problem, but it has resulted in some curious observations, for example, a freshly laundered poodle has a much greater effect on diffuse irradiance than a mud splattered labrador.  This is thought to have no scientific interest.

General Comments


An important part of the data collection process is the notes taken at the time, these provided an explanation for some of the variance.

  • Haze.  This was present on several summer days, the effect was to increase the diffuse irradiance to over 200 watts/m2.
  • Low Level Cloud. If cumulus is forming or present in the sky, the diffuse irradiance will rise above the clear sky level.  The presence of low level cloud implies that the relative humidity in the lower part of the atmosphere is close to 100%.  In an otherwise clear sky, small fragments of cumulus can form and disperse very quickly.  It seems that the formation of a cloud is preceded by an increase in diffuse irradiance.
  • High Level Cloud. Except when the high level cloud is between the sun and the photocell, high level cloud causes little or no increase in the diffuse irradiance.
  • Jet Trails. Occasionally, the total irradiance would dip as an airliner came between the Sun and the photocell.  One morning, a larger than average jet trail appeared, this was probably created by an Airbus A380 bound for one of the Paris airports.
  • Morning/Afternoon Variations.  It is common for there to be significant differences in the irradiance before and after solar noon.  In the south of England it is common for the sky to be clear during the first half of the morning after which clouds start to form, as a result, the irradiance is higher in the morning than the afternoon.  In other climates, irradiance can be at a maximum in the early afternoon.
  • Seasonal Variations.  Two factors which influence solar irradiance are the water content of the atmosphere and aerosols and these vary according to the season and climate.  In southern England the water content is higher in late summer and early autumn than in the winter months.
Calculations

In the South of England, the "economic" range of air mass is approximately 1.5 to 6.0.  In this range the plane parallel method of calculating air mass provides a reasonable approximation and some computational convenience.  The calculation (with the exception of the equation of time) is described on this page:

Sun-Earth Geometry

Results so far.

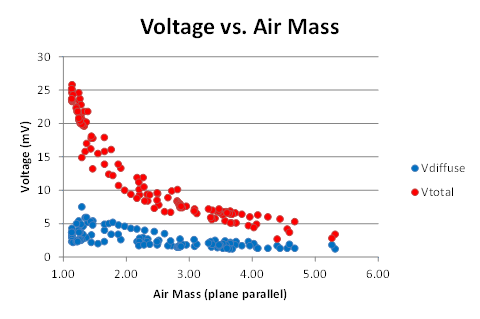
The first graph shows the voltages plotted against the plane parallel air mass:
Extracting the diffuse measurements and breaking them down by the state of the sky gives this graph:


The data for hazy days and those when there were a few cumulus in the sky are distinct from those when the sky was almost free from cloud or contained a few or scattered high level cloud such as cirrus.


First Attempt at a Model

Experience with this photocell suggests that its sensitivity is approximately 40 mA per watt/m2 as the resistor is 1 ohm, this becomes 40 mV per watt/m2.  Discarding the haze and cumulus and amalgamating the clear and cirrus set and expressing the results as watts/m2 gives:


This is a reasonably tidy dataset, however data is not evenly distributed across the range of air mass, however, a simplistic curve fit using the same form of equation as the Meinell model has been attempted.  It is probable that as more data is collected, the values of the constants will change.


At the time of writing, only limited testing has been done using this diffuse irradiance model.  It appears that when combined with the Meinell model it produces better estimates of global horizontal irradiance than simply making the diffuse element a fixed fraction of the direct beam component.  The graph below shows an estimate of the global horizontal irradiance for a clear, June day on the South cost of England, this appares to be reasonable when compared to the output of a personal weather station.

A more systematic evaluation will take place when a full year's data is available.

Correlations

For most locations, not much is known about the state of the sky at any given time.  The nature of the irradiance can be source of information about the atmosphere.  Initial attempts to correlate the data with  derivatives of temperature and dew point data from the surface weather reports from the nearest airfield (approx. 7 km to the west) have not been successful.  An initial attempt has been made to use data from NASA Aqua satellite obtained from the NASA Earth Observations website and this suggests an interesting line of enquiry.


If the data is broken down into three bands defined by aerosol optical depth, there is a suggestion that the data will segment:

Some of the highest values of V diffuse were observed when haze was clearly visible and  haze is associated with high values of AOD, similarly, the lowest values were obtained when the AOD was also low.  This is to be expected because AOD is one the inputs to parametric models of solar irradiance and it is also used as indicated of air quality.


A similar exercise with water vapour as less conclusive.

Variations on this theme using parameters based on surface temperature and dew point produced similar results.

Future Work

There are three tasks:

  • Continue collecting data when the opportunity arises until at least until April 2014 to obtain a dataset extending over a full year.
  • Determine if the same process can be extended to create a location specific model for direct normal irradiance.  This can be calculated from measurements of global and diffuse horizontal irradiance, however, the equipment in its present form may not be able to provide data of adequate quality without modification.
  • Attempt a model which accounts for seasonal variation.
Acknowledgement and Appreciation

Data relating to Aerosol Optical Depth and Water Vapour was obtained from the NASA Earth Observations website. The data available on that site is highly instructive and I would like to express my appreciation to NASA and NOAA for making it available. 


Friday, 3 January 2014

Starting over

Not too far from where I live is a house that was built sometime in the 1980s, I guess it was none too comfortable to live in.  Whilst it was being partially demolished, I did not see any signs of insulation, just a lot of windows with rotting frames and a load of rusting radiators.  Technically, it is being extended, but in reality, it is being rebuilt.  The roof is well insulated, the walls have a 100 mm layer of polystyrene and the windows are double glazed.  Not wanting to be a nosey neighbour, I have not enquired about the heating system, however, I know that a wood burning stove was installed in a similar development and has yet to be lit.  Retrofitting a property to that standard would be difficult and expensive and unlikely to pay-back.  That statement is based on a study of my own home where you could spend a lot of money, not be much warmer and would lose the character of an airy Edwardian semi.

Sustainability is much easier to attain with a clean start.  I am currently working on (more accurately "staring at") an electrical storage project.  Storage is one of the key components in a sustainable energy economy, but batteries are DC devices and my home is wired for AC.  AC is a logical choice for distributing electricity, but increasingly it is consumed at DC.  Some time back I did a quick survey on how we use electricity in our home and produced this graph, this suggested that only 15% of electricity has to be consumed at 240 volts/AC or in other words the washing machine and vacuum cleaner.  Some things like the fridge are available in low voltage DC forms, computing and entertainment devices all have power supplies to shift from high voltage AC to low voltage DC.  We are slowly migrating the lighting from CFL to LED devices.  Each LED light bulb has its own power supply circuit for AC to DC conversion.

Even though most things use low voltage DC, distribution within the house is 240 volts AC,  That was a logical way of doing things in the 1920s when electricity was first installed and all appliances used AC, the better part of a century later, there may be some value in examining household distribution. 

If storage were to be part of the household energy system without any radical changes in wiring, the first step would be go from 240 volts AC to 12 or 24 volts DC for battery charging, the battery would be connected to an inverter to get back to 240 volts AC to go through the ring mains, devices connected to these would then drop it back to low voltage DC.  This would be a complex and inefficient system and one which is not going to get built any time soon.  The small DC storage project is all DC, albeit with some level shifting, and is relatively simple.

I stumbled over another example of the complexity of legacy systems.  When the railways moved from steam engines to electric motors, high voltage DC was chosen because at the time only DC motors could provide the high starting torque needed to get a train moving.  Modern electric trains (so I am told) use AC motors.  Thus the grid feeds trackside substations with AC, this is converted to DC for the trackside rails, the train then converts it back to AC.  I doubt if the losses in this system are great, but the result is a complex system with DC for traction and 3 phase AC for everything else.

In the UK there is a debate over how to curb emissions which can be grossly oversimplified to nuclear versus the renewable technologies such as wind and solar.  My own view is that there should be different paths for "old" systems and "new" developments.  For the legacy systems which are based on large amounts of uninterrupted energy from fossil/nuclear sources, the key technologies are conservation and energy management.  It is valid to determine if it is possible, practical and economic to build new systems which are more or less dependent on renewable resources which are discontinuous (the Sun does not shine at night and the wind does not always blow), these would incorporate appropriate technologies, e.g. LED lighting and storage.  It's so much easier to design these things from scratch and not have to mess with the past.


Friday, 20 December 2013

The Winter Solstice

This is was written a few days before the Winter Solstice when the day is short and the Sun is low in the sky.  It is the time of the pre-Christian festival of Yule, regardless of one's religious beliefs, this is a time of year when the spirits need lifting from the cold and damp with parties and festivals.  At present I feel a strong desire to keep warm by setting fire to something that died a few million years ago.

Most religious festivals are linked in some way to the land and climate in which they are celebrated, for example, Candlemas (Feb-2) coincides with the time the soil starts to warm after the winter and Easter marks the start of the growing season and so on.  Whilst these events were once marked in some way, we increasingly isolate ourselves from seasonal variation with central heating in winter, air conditioning in summer and strawberries in November.  This process started with the large scale use of coal at the start of the Industrial Revolution around 1750.

The graph shows the estimated clear sky irradiance over Southern England at the time of the solstices and the equinoxes.  The energy yield at each time is proportional to the area under the curve, or to put it another way, its cold in winter and warm in summer.  It is possible to do similar things with wind.

We are an urban and industrial society and there is not going to be a return to the rural idyll (if it ever existed) any time soon.  Yet understanding and appreciating the climate and economy in which we live can lead to good designs and better decisions.  The sustainable energy economy is a big challenge and it is important to realise what can be achieved.  Industrial and urban economies need continuous supply of energy, part of the base load created by street lighting, transportation, schools, hospitals, data centres, pub signs etc..  I suggest that there is little public support for a railway system powered solely by wind turbines.  Sailing ships were displaced by coal fired steamships because they could run to schedules and were big enough to accommodate all who could afford to travel.  This base load will be underpinned for the foreseeable future by fossil/nuclear generation. Within that sector of the energy economy, the key elements are conservation, management and storage, implementation of which is not helped by legacy systems.

I'm embarrassed to admit it, but some of my interest in sustainable energy was sparked by the 1970s BBC TV series "The Good Life" in which an attractive young couple unimaginably named Tom and Barbara Good, but played endearingly by Richard Briars and Felicity Kendal attempt self-sufficiency in Surrey.  Needless to say the challenge was a rich source of humour.  My wife is too well grounded to let me indulge in such fantasies so I have contented myself with a paper project to provide 1 kwh per day from renewable sources without costing the Earth.  Whilst pondering this problem, I have learnt how to mount transistors in TO 220 cases, a little about controlling them with a computer, but I'm still struggling.  My backyard almost makes us self-sufficient in garlic and provides a small supply of vegetables of the type normally discarded by supermarkets but as a source of wind and solar energy it is a sad disappointment.

The path of helium filled balloons which have escaped from young partygoers suggests that at around 500m there might be a steady wind, but the neighbours, tolerant in many ways would not accept an airborne wind turbine.  A boat on a river estuary might work, but my wife is too well grounded to let me indulge in fantasies.  The obvious solution is to buy electricity from people who generate it from wind, solar and other sustainable sources and use the grid as a delivery system.  But energy from these sources is a natural product whose availability changes with the seasons.


Thursday, 12 December 2013

How do you learn about this stuff?

I first became interested in sustainable energy around 2005.  This was before the financial crisis of 2008 when environmental issues were aspirations, not perceived as costs (maybe I exaggerate).  A 2.5 kw rooftop PV installation cost between £15k and £20k and there were no feed-in-tariffs, not surprisingly there were not many to be seen.  DIY superstores were selling 1 kw wind turbines for around £1,500 (I think) and there were stories in the press expressing horror at the low yields, this was not surprising considering that rating was usually for wind speeds around 15 m/s (approx. 30 mph), whilst this is not a gale, its the sort of wind you don't feel too often (for which many of us are grateful).  I struggled to understand this stuff.

Most of my working life I've been lurking in the shadows between technology and economics.  A traditional engineering education did not include economics and the attitude towards its practitioners was illustrated by graffiti  in engineering faculty toilets above the loo roll dispenser which read "Economics degree, please take one".  However, there was an implicit understanding that there should be a link between technical performance and economic benefits, however dubious.

My perception of wind and solar energy systems is that they are conversion devices, the input is "weather" e.g. wind, sunshine, cloud etc. and the output is electricity or heat.  Attempting to understand this relationship has led to the combining bits of wood, drain pipes, Meccano and a sketchy knowledge of electronics into experiments.  I realise now that I must have been a sad disappointment to those burdened with teaching me carpentry, metal work and technical drawing, be grateful that I trained on aircraft engines and did not become a kitchen fitter.

My first attempt around 2007 was the "Solar Bucket", this consisted of three components, a small solar panel, a lead acid battery and several devices to use the energy harvest, the most useful being an early LED light.  The photo shows the panel on a winter's day.


This provided some valuable experience.  It illustrated seasonality, the effects of clouds and much more.  The battery component was originally intended as a measurement device.  I was a little slow to realise it but the battery was the important component, storage is a key element of a sustainable energy economy.  I've heard several people say things like "I want solar panels to make me independent of the energy companies" (or variations n the theme), but the Sun does not shine at night, so without storage they are as dependent on fossil/nuclear fuel as the rest of us.  I argue that investment in energy storage would give a better outcome than more rooftop PV.  As I write this I am staring at more plywood, batteries and wires designed to act as a realistic load for energy management software.

Instructive as the "Solar Bucket" was, it did not act as a resource meter.  This resulted in several attempts at making radiometers.  Initially, these used light dependent resistors and did not work, as these are successfully used in cameras and other devices, the problem was my lack of knowledge.  At some point I purchased a batch of small, flat monocrystalline PV cells for about £1 each and these work well.  The current device could be described as a shaded radiometer and for some reason it attracts the attention of dogs.  The concept is simple, a horizontally mounted cell measures global irradiance, then a shade is placed between the sun and the cell, it then measures diffuse irradiance.  Combine these two measurements with Sun-Earth geometry and you can get an estimate of the direct beam irradiance.

I'm trying to estimate the accuracy of this device, but it suggests that the water content of the atmosphere has has a significant effect on irradiance and particularly diffuse irradiance.  There are some good models of clear sky irradiance, but some of these require data which is not readily available or are related to the climate in which the observations were made, this is an attempt to understand my own back yard.

The first radiometer was simply a PV cell shorted with a resistor, the current and therefore the irradiance was measured by measuring the voltage across the resistor with a multimeter.  For several months, I took readings with the cell horizontal with it angled at approximately 50 degrees to the horizontal.  Under a clear sky, pointing the cell in the direction of the Sun increases the output, this maximises the yield of solar devices in summer, but in winter, the English sky is often full of thick stratus cloud, on these days, the output of the PV cell was greatest in the horizontal position.  The object below was constructed to explore this further.


It consists of a light dependent resistor mounted at one end of a length of waste pipe which is mounted so that measurements can be made around the sky's hemisphere.  On an overcast day, the diffuse irradiance was equally distributed about the the sky, whilst on a clear one it was principally from the direction of the Sun.  This suggests that the yield from PV devices in an English winter might be maximised by mounting the panel horizontally.

My home is located on the western side a a valley in an area where the prevailing wind is from the south west, so we are fortunately sheltered from much bad weather.  Whilst solar is a back yard technology, observing the wind means leaving the house.  A lot of wind speed data is collected in clear open space such as airports, offshore buoys and weather balloons.  The data from these sources often relates to the flow of air over a relatively smooth surface and can have little or no relationship with the wind in nearby urban or rural environments.  In these places, the wind eddies around buildings and trees and neither the speed or direction is constant.  In this type of environment, vertical axis wind turbines offer some advantage.  I horizontal axis machine in an urban setting will often "hunt" for the wind, by the time it has aligned itself with the flow, the gust has dissipated.  I was first introduced to the Savonius design by a university friend from the Caribbean, whilst we were taught about marine, automotive and aircraft engines, simple devices for working irrigation pumps got little or no attention.  The Savonius device has two attractive features, the first is that it is not subject to the complex forces seen in other vertical designs, the second is the ease of construction.  In the West Indies they are often made by cutting a 40 gallon oil drum into two, then welding it back together so that it looks something like the model in the photo below.

A few happy days were spent cycling around the city and taking this model to the top of multi-storey car parks, to the end of breakwaters  and occasionally attracting the attention of dogs.  If you are a man wanting to attract women, borrow a puppy, if you want perfect solitude get a model wind turbine.

I did spend some time messing with a dynamometer for the Savonius model, but abandoned it when I realised that I would have little use for the data.  The Meccano tower lingered in my work room reminding me of the value of time.

What have I learnt?  The main lesson is that a sustainable energy economy is complex, its not just a case of shutting down nuclear power stations and seeding the countryside with wind turbines and putting a solar panel on every roof.  Its a blend of realistic expectations, generation, management and storage which is a large technical challenge, but so was developing the technology for nuclear power stations so we've been here before.  Also don't ignore economics, there is a belief held by some well meaning people that sustainability is above economics, one man's feed-in-tariff is another man's economic cost and this does not lead to good decision making.

Its quite possible to do a lot of experiments with limited resources.  The basic rule is to make mistakes cheaply and realise when you are wasting your time.  I put a lot of effort into a solar thermal device, this had a collector area or half a square metre, looked quite impressive but was useless for anything other than drying washing.  A series of small panels each 10 cm square cost very little and were quite instructive.