Pages

Showing posts with label Wind. Show all posts

Sunday, 2 June 2019

Doris B - Carpentry and Computing

The design is slowly moving forward. I’ve messed with small wind turbines before, but Doris B is an attempt to create some design rules. The objective is to get an output of 2.5 Watts in a 5 m/s wind. The current rotor is 0.7 metre in diameter with six buckets and s of the drag type. It’s had a couple of runs without instrumentation, but eyeballing the rotor suggests that its operating speeds are between 50 and 150 rpm. The current activity is figuring out the electrics and creating a functional data logger.


Almost any design of turbine will turn in a 10 m/s wind, but at 5 m/s the available energy is about 70 Watts/m2, which is not a lot, thus small things become important. The first attempt at creating a power box used a basic silicon bridge rectifier, smoothing capacitor and a voltage regulator. The voltage drop across the diodes in the rectifier was approx. 0.7 – 0.8 volts which is about 10 – 15% of the voltage of the generator, the rectifier will shortly be replaced with four Schottky diodes which hopefully will have a voltage drop of around 0.3 volts. The voltage regulator did nothing useful, three partially discharged Ni-Mh cells drew around 300 mA without the voltage regulator which is roughly a charge rate of 0.15 abd a reasonable working level. Removing the regulator cleaned up the power curve, which currently looks like this:


Part of the design is to match the power drawn by the generator to that generated by the rotor. With no load, the generator turns freely in a light wind. place a 10 ohm resistor across the terminals and it seems likely that it will cease to do so. Experiments with pulse width modulation of the load suggest that this is a potentially efficient way of optimising the relationship between the rotor and generator.

My love of the Arduino is growing steadily. Over my professional life, computing power has increased dramatically, CPU speeds are now measured in GHz, RAM in GB and storage (which is not necessarily local) in TB. The Arduino Nano was originally purchased as an analogue to digital converter for a Raspberry Pi, however, with experience, I’m realising the capability of the Nano. This should not be be surprising, my first programming experience was on an ICL 1900 which if I remember correctly had 16 Kb of magnetic core storage, static data lived on punched cards and if that was not enough the only option was a tape drive which required serious negotiating skills to access. Those machines were a great opportunity and so are the Arduinos. If you are used to working with GB databases, 1 Kb of EEPROM does not seem a lot, but it’s enough and there is the potential of IoT to explore.

Footnote – A month ago, my laptop died, it was expedient to hook up a Raspberry Pi. At some point I will have to replace the laptop, but the Raspberry Pi is doing fine, I have not done any serious analysis, but the energy I use whilst messing with computers might have dropped by 0.5 kwh/week (a guess)


Friday, 26 April 2019

Doris B - Instrumentation

It’s a sad fact that almost everything I make gets built at least twice.  I’m trying to figure out what needs to go into the wind turbine’s “power box” and how it’s going to fit, then I’ll rebuild it so it looks less like a building site and use components with appropriate values.


It monitors the rectified output of the generator, the voltage across the load and the current through it.  This allows the power generated and being delivered to the load to be estimated.  A Fourier transform is used to determine the rotational speed.  The original intention was to work with AC output of the generator, but it proved a lot simpler to work with DC throughout the whole system.
The Arduino Nano has exceeded expectations, a previous attempt used op-amps and many other components, however, this time around, the only components used in the instrumentation are resistors for voltage divides and zenor diodes for protection.  voltages from three measurement points are fed to the Nano’s ADC.  After some processing with a couple of blocks of Python code running on a Raspberry Pi, the output looks like this:

Testing is being done using a 47 ohm resistor as a load, this keeps the current low but at the expense of high voltage on the upside of the regulator.  When a battery pack is used as a load, the voltages look a little more sensible.  Still some work to do, but the basic design is in place.
The next task is to determine if pulse width modulation can be used to control the load, if so, if so, it may be possible to optimise performance.  Ideally, I want the rotor to start to turn at 4 m/s, but the high torque of a large load may prevent this.  Maybe if the duty cycle is 0 when the turbine starts, it can be increased as the rotational speed increases.  Also, it can be adjusted to take account of low wind speeds.  All that comes after I’ve soldered the bits together.

Saturday, 20 April 2019

Doris B - Power Curve(2)

Progress (and more to learn and some bugs to find).  The Arduino captured a one minute time series of the voltage across a 22 ohm resistor attached to the generator’s output terminals whilst it was hand cranked.  The load on the crank varies during a rotation so there are constant variations in speed and this can be seen in the time-series, the flywheel effect of the wind turbine’s rotor will probably have a smoothing effect.  The circuity between generator and the ADC needs to include a zenor diode to provide some protection for the chip, once that’s in place, the DC biasing can be setup sensibly.  However, the time series was good enough to passed through a Fourier Transform routine which allowed the rotational speed to be estimated.

The speed and voltage data can then be combined into a power curve, the variations in power are due to uneven cranking.  The 22 ohm resistor was chosen because I had one in a box somewhere.  To get peak performance from the generator will require matching the impedance of the load to the impedance of the generator.  The planned load is a USB power pack.


Whilst messing with electronics and Fourier transforms has been instructive, so too has hand cranking the generator, clearly the torque required varies with the value of the resistor, with a 10 ohm resistor the torque required almost pulls the generator of its mounting.
So on the next trip to the beach, I’ll take a bag of resistors and see how they effect the ability of wind to turn the rotor.

Wednesday, 17 April 2019

Doris B - Power Curve(1)

In order to match the rotor to the generator, it is necessary to understand the behaviour of both. The first step is to grab data, starting with the generator because this can be done on the workbench rather than the beach. Much the same solution can be used for both. Currently, the instrumentation is an Arduino Nano which provides analogue to digital conversion (ADC) and a Raspberry Pi for processing. Electricity and electronics were part of my OND but that was a long time ago, so setting up the tests involved a little vexation, but eventually a Python programme managed to capture a sample of the output of the generator.


Two things became apparent, first the output of the generator is complex and not a simple sine wave, Secondly the starting torque increased significantly from the open circuit value when a resistor was placed across the terminals.


The next step is to analyse the data, the plan is to use a Fourier transform to determine the rotational speed and the area under the curve will provide the energy generated, putting the two together will provide a power curve (I hope). The Ardunio is a brilliant tool and may offer a solution to the high starting torque. If pulse width modulation is applied to the load, the turbine can start with no load and as speed increases the load on it is increased, this in turn could provide a means of optimising performance.

Friday, 12 April 2019

Doris B - First outing

 On Wednesday evening I took Doris B up to Green Ridge and assembled it.  The wind speed was  roughly 5 - 7 m/s.  Whilst held aloft, the rotor was 2.5m above the ground, it turned smoothly and quietly, which was pleasing, an earlier version had struggled to turn at 10 m/s, so progress is being made.  The next step is understand the relationship between the rotor and the generator,  The speed of this type or rotor is proportional to the wind speed and it is important that the rotor turns fast enough for the generator to produce a useful output.  On returning home I ordered some bridge rectifiers and  an Arduino Nano.  The first use of these will be to obtain a power curve for the generator.

My favourite place for messing with this stuff is on the beach at Aldrington, when the wind is from the SW there is little turbulence.  Most of the other people are beach fishermen and we occasionally swap observations on the state of the sea.  There was a curious incident at Green Ridge, a dog walker scooped up his spaniel, carried it over to my rucksack and let the dog have a good sniff, then walked off carrying the dog, I said "good evening" politely.

Wednesday, 10 April 2019

Doris B - Trial Assembly

10-April-2019 - Completed the partial assembly of the Doris B5/6 small vertical axis wind turbine this morning before giving it a trial outing on the Downs later today. 


The objectives of the initial trials are to determine if it rotates in a wind of 5 m/s and does not disintegrate at 10 m/s. If it survives, the next step will be add some instrumentation and to try and figure out how it works. The design is based on some maths, guesswork and wishful thinking. There have been four previous versions, mostly made of Meccano and sawn up bits of plastic pipe, this one is mainly made of wood. This is not a finished design but part of a process of learning how to make small wind turbines for rural and urban environments, hopefully the design will evolve. The objective for this series is an output of 2.5 watts (similar to a standard USB port) at 5 m/s.

Friday, 26 February 2016

Messing with model wind turbines

If there is a theme to these posts, it is learning about sustainable energy.  Staring at a wind farm or an array of solar panels can be instructive, but some personal experience is always useful, even with the limitations imposed by small models.  These two models were made with materials which were lying around where were a length of drain pipe, some plywood offcuts and a random selection of Meccano.  If I ever repeat this exercise, I would opt for a lighter construction and a small alternator as a load.  An attempt at making a dynamometer was not wholly successful.

Wind in urban and rural areas is often turbulent and gusty with frequent changes of direction.  There are a few small horizontal wind turbines in our area, the only ones which give the impression of running continuously when the wind is blowing are those mounted on tall masts.  One of the attraction of vertical axis turbines is that the can adapt to frequent changes in wind direction without having to "hunt" for the wind, another is they are quite simple machines.  Many Savonius turbines used in the Caribbean to drive irrigation pumps are just a 40 gallon oil drum which has cut in two along and welded back together.  I am not fully convinced that rotating machinery has a place in the urban environment, however, the Savonius design  has some inherent speed limitation.  For these reasons I opted to mess with vertical axis designs.


The advantage of models is that they can be moved around on a bicycle and tried in various locations.  Despite mounting the Savonius model on a 5 metre pole, it never turned continuously in my back yard whatever the wind was doing elsewhere, that was a useful lesson.  About 7km to the west of where I live is a small airfield where the remains of some of the Second World War defences are accessible.  The roof of a pillbox which had been build on an embankment is about 10m higher then the surrounding flat terrain, here the Savonius model spun freely and smoothly.  The wind there is both smooth and steady.  In contrast, performance on the upper level of multi-story car parks in the city centre was disappointing, the turbine would spin during gusts, then stay sullenly stationary for at least 30 seconds before starting up again.  Performance on jetties along the sea front was good if the wind was blowing of the sea and poor if it was coming from the land.  I did not investigate too closely, but the wind at the top of cliffs appeared to be complex, I may have formed a different opinion if the turbine had been on mast rather than at head height.  It is important to be careful in public places.

I had no desire to draw attention to myself, but with the exception of a large Alsatian called Trooper I was allowed to engage in this bizarre activity without interference.

I had been intrigued by the Darrius design of turbine, however, the model refused to do anything useful, which with hindsight is probably a good thing.  The most probable cause was poor construction which did not allow for setting an appropriate angle of incidence on the vertical blades.  An afternoon spent figuring out the aerodynamics of this type of machine was useful.

Whilst this design looks simple, the aerodynamics and resulting stresses are complex, had the thing worked, it would have probably shaken itself to bits.  I'm not certain of my facts, but I think that this design is capable of over-speeding under no-load conditions.


I became somewhat more absorbed in this project than I intended and when time permits I want to build another Savonius model.  If I proceed with a second attempt, the design will incorporate a small alternator to act as a load and provide some indication of output.  The first attempt used a fluid clutch attached to a torsion spring, this was a good illustration of the rule which says "if it looks complicated, it's probably wrong".  Secondly, the rotor would consist of three segments each 120 degrees apart, this would smooth the output torque and prevent the rotor getting "stuck".  Most of the time the Savonius was self-starting, but occasionally act like a weather vane until given a sharp prod with a finger.  I have seen some beautiful picture of Savonius turbines where rotor is a spiral which suggests the possibility of making a turbine into a garden feature.

Both models are being dismantled for firewood and the recovery of the Meccano bits.


Wednesday, 30 September 2015

Doris - A thought experiment in progress (12) - And your point is?

Doris is a thought experiment running on a Raspberry Pi and a laptop which is intended to explore sustainable energy, an evolving description and discussion can by found in a previous posts starting with:
It is becoming generally accepted that energy storage can increase the proportion of energy generated from sustainable sources.  Regardless of my efforts with Doris, the aspiration supports international conferences and significant investments in technology are being made.  The concept is not futuristic, products such as Tesla's Power-Wall are coming to market and the internet-of-things which can provide data and control functions is evolving.  The question is where does it fit into the energy economy.  I'm an enthusiast for LED lighting, it works, I get payback (albeit on a small investment) and as we replace CFLs, our energy consumption is slowly falling.  For me as an energy consumer, the economics of storage don't work at present.

This is a well worn quote from the CEO of a cosmetics company; "In the factory we make chemicals and in the shop we sell dreams".  Similarly, we don't buy energy, we buy what it facilitates, e.g. lighting, cooking, entertainment etc.  Putting storage into the system does not cause us to use less energy, just gives us the option of increasing the diversity of sources.  Most consumers don't want a hike in their bills, but many might except higher unit costs if the total bill remained unchanged, thus a prerequisite to the adoption of storage might be energy management and efficiency which creates a cash flow for investment in storage.

At an industry level, the sustainable energy generation capacity is increasing, largely due to offshore wind farms.  However, wind farms are underpinned by conventional generating capacity.  The graph shows a breakdown of the sources of electricity on a pair of Saturday afternoons in October, one was a windy day and the other a calm one:

On the calm day, the gas and coal take over from the wind. This is a reasonably simple investment situation based on producing a product and selling it.  Having read the accounts of some generating companies, the owners of some gas fueled plant view  wind as a competitor and a complicating factor in their economics.  From a sustainability perspective (using number picked from thin air) it better to have four gas fueled plants and two wind farm rather than five gas fueled ones and one wind farm.  Storage helps achieve this.  However, the process of investing in storage rather than generating capacity is a complex one.

In the post war period until the 1990s electricity generation was managed by the CEGB.  In recent years the ownership of generating capacity has become highly diverse.  Participants include banks (possibly because of their deep understanding of markets), privatized power stations and interestingly Scandinavian companies with experience of offshore oil and gas operations have taken a position in the UK offshore wind sector. Would a larger element of central planning give a better outcome for emissions and sustainability?


Friday, 18 September 2015

Doris - A thought experiment in progress (11) - Flights of Fantasy


Doris is a thought experiment running on a Raspberry Pi and a laptop which is intended to explore sustainable energy, an evolving description and discussion can by found in a previous post:
It is important to remember that Doris is a computer simulation with some arbitrarily set parameters and rules, it exists only in the imagination and has no physical reality.

With a database and software background, it seemed that a good way to learn about wind and solar energy was to find a bunch of varied data sets and poke around them with SQL.  This has been instructive, but so to has gardening and looking at the location of old corn grinding wind mills.

Weather balloons are a source of wind speed data.  I'm guessing, but there is probably a GPS built into the instrumentation which provides the data needed to estimate the balloon's speed and direction.

Wind is fluid flow over a surface, for smooth surfaces like a calm sea, the friction is low compared to that created by a jagged urban environment. The effect of friction is greatest close to the surface, but at around 1,000 meters, it is much less significant.  I think any investment in wind power technology should be preceded by a site survey, but without that it can be useful to attempt to estimate the wind speed from a reference location, one way of correcting for height is this formula:

There a alternatives which give different results, but this one has the virtue of simplicity.  Most surface wind speed data is collected at 10 meters, the graph shows how the wind speed might increase with height, at 1,000 meters, it is almost twice as fast as at 10 meters.


This graph shows a wind speed distribution at 850 meters (a standard reporting level) which was compiled from weather balloon data.  The average speed is approximately 10.0 m/s, at the surface, the average speed in a similar location might be 5.0 m/s.

This data suggests that the sky is a good place to capture the wind's energy. There are some talented and created people who are attempting to do this; there are a couple of links at the bottom of the page which might be a good start to reading around the subject, one of them, the Makani project is backed by Google.  The designs seem to divide into two groups, one approach is to get the generator aloft with  a kite or ballon and feed the electric energy back to earth with a cable attached to the tether.  The other is to capture the kinetic energy with devices like kites or rotors and use this to drive a generator on the ground.

I have not run any upper air data through the Doris simulation software as one of the parameters of the project is that it should only model readily available product and services.  It's easy to find reasons for dismissing airborne wind energy devices but fuel cells used to be exotic but now the technology is being incorporated into production automotive vehicles, so someone might make it work commercially.

Related material

Wednesday, 16 September 2015

Doris - A thought experiment in progress (10) - Urban Wind

Doris is a thought experiment running on a Raspberry Pi and a laptop which is intended to explore sustainable energy, an evolving description and discussion can by found in a previous posts:
It is important to remember that Doris is a computer simulation with some arbitrarily set parameters and rules, it exists only in the imagination and has no physical reality.

Back in 2007, before the financial crisis, some DIY superstores were offering small wind turbines.  From what I remember, these had a nameplate rating around 1 kw (at 10 - 12 m/s, or 20 to 25 mph) and cost about £1,500 excluding mounting.  They could be installed either on a pole (10m high (?)) or strapped to a chimney stack (not a good idea).  Stories appeared in the press saying that they did not work too well and the take up was low.

There are several ways of working out the economics of a project, one of which is to watch how people behave, in the 1 km radius of where I live and walk my dog, I am not aware of any households with wind turbines, however, there are a lot with solar panels, mostly PV, but some thermal.  Solar panels will do something useful in any reasonably open south facing location, but turbines are very sensitive to location.

When I first started messing with this stuff, it seemed that there was a lot of data to play with, however, this is a lot of good quality information about the wind around airports, but but not much about urban and rural areas.  I have amused builders working nearby by standing in my backyard with a wind speed meter showing light airs when there is a gale blowing on the seafront a mile to the south.  Whilst trying to understand the variation in wind speed, I did a couple of cycle rides with a wind speed meter.

One of these was around the town, pausing to estimated the average speed over a 3 minute interval in a several locations, public parks, the beach, the cliff above the beach and multi-story car parks, these estimates were then compared to the speed reported from an airfield a few km to the west which was about 16 knots.  The result was this graph:
With exception one of the beach locations, the average speed was significantly less than at the airfield, equally significant was that nature of the wind which was often turbulent and gusty.

Another trip was up to the hills to the north of the town, I used the GPS on my phone to record the location of readings, which were then plotted on a contour map generated using data from the SRTM Space Shuttle mission and overlaid on Google Earth, the result was this map:


The figures are the ratio of the observed speed to that reported at the airfield.  This can be summarized as the wind speed is higher on the ridges than in the valleys, maybe a space rocket was not needed for that observation.

The accuracy of the measurements displayed on both these graphics is not high, but I think they give a reasonable impression.

I'm not convinced that small wind turbines are suitable for dense urban housing, I have memories of the 1987 hurricane that passed through the south of England when the air was full of tiles, trees and other debris, bits of wind turbine would not have been a welcome addition.  However, I am intrigued by some vertical axis designs that could be incorporated into a suitably strengthened roof.  A rotating machine strapped to a Victorian chimney is something no man can face with equanimity.

Running a data set of urban wind through Doris gave this graph.


For this run, the wind generating capacity was reduced to 0.5 kw.  The contribution for wind is significantly less than that of solar and does little to offset the seasonal nature of solar.  The data set was randomly selected and I'm guessing that there could be a wide variation in results, for example, a house located at the top of a ridge, might get a significant yield from a small turbine, whilst one in a sheltered valley would get almost nothing.


Sunday, 13 September 2015

Doris - A thought experiment in progress (9) - Going offshore

Doris is a thought experiment running on a Raspberry Pi and a laptop which is intended to explore sustainable energy, an evolving description and discussion can by found in a previous posts:
It is important to remember that Doris is a computer simulation with some arbitrarily set parameters and rules, it exists only in the imagination and has no physical reality.

When I first started looking at wind as a resource, It became apparent that there is a considerable variation in the nature of wind, even within a small area.  For example where I live on the south coast of England, there are at least five regimes (the average wind speeds are for comparative purposes only):
  • The open spaces around an airfield, typically these are located in uncluttered areas away from hills and other natural obstruction to air flow.  Airfields are the largest source of wind speed data, but it may not always be relevant to wind turbines, the average speed might be 5.0 m/s.
  • Urban and wooded areas where the rough surface attenuates the wind speed and causes turbulence, mounting a turbine on a tall mast reduces the effect of these, but these may not be practical or desirable.  In this situation, the average wind speed might be 1.0 - 3.0 m/s.
  • Special locations, these include ridges and hills where the air flow is not obstructed by the surrounding terrain and may even be enhanced by it.  An average speed might be 6.0 m/s, data on these locations is hard to come by, but looking at the location of corn grinding wind mills can be instructive.
  • Offshore, relative to the land, the surface of the sea is smooth and losses to friction and turbulence are much lower, the average wind speed in an offshore location might be 7 - 9 m/s.  Data sources are offshore platforms and moored buoys.
  • Coastal areas.  When the wind is blowing off the sea it can be smooth, but when it is blowing off the land, it becomes turbulent.
The graphs below are not strictly comparable and only serve to show the difference in the nature of offshore and offshore wind.  Doris uses the latest available weather report, to form a distribution, it is preferable to have regular sampling, say, just use the reports that are on the hour.  The height at which the observations was made was probably different.  Height correction was not applied in the compilation of these graphs, although Doris does make some adjustment in estimating the energy that can be extracted from the wind.

For the onshore location, the mean wind speed is approximately 5 m/s and the distribution has a clearly defined mode at around 8 - 10 m/s.
 Offshore, the average wind speed rises to approx. 9 m/s, more importantly, the proportion of observations which are less than 5 m/s is much lower.
The amount of energy that can be extracted from a stream of wind is proportional to the cube of it's velocity, the wind flowing at 7.5 m/s has the potential to provide more than 3 times the energy of one flowing at 5.0 m/s.  This accentuates the difference between onshore and offshore wind.

Whilst the energy yield from offshore wind is potentially greater than onshore, so are the costs which might be two to four times higher.  The higher costs come from two sources, the first is the high cost of working offshore which requires similar equipment to that used by the oil and gas industry for building platforms.  Secondly, the installations need to have the resilience to withstand storm conditions and be tolerant of the corrosive effect of salt.  The relationship between onshore and offshore locations involves some complex economics.

Running an offshore data set through Doris produced the following graph (some software changes are needed to make the solar component in each graph comparable, they will be updated when this is done, however, the nature of the graph is not expected to change much).  To take account of the offshore data set, it was assumed that the access to wind generating capacity was reduced to 0.5 kw, it is 1.0 kw in the onshore base configuration.


The difference between the two plots is the lower draw down from conventional sources, this is in part due to the higher output and in part due to the smaller number of days when the yield from wind is low.


As with all the output from Doris, there are some gross oversimplifications, one of which may be the ability of wind farms to deliver energy at low levels, this needs to be understood and some allowance built into the model.

Author's Note

Due to some odd career advice, I left school at 15 and was for two year's England's most incompetent merchant seaman.  The fact that I have spent most of my working life writing computer software suggests I was not cut out for a life on the ocean wave. At the time I did not know that what I saw on lookout duty on the monkey bridge could be described in terms of wind speed distributions or Fourier transforms of wave motion.  In the context of this post, I appreciate the complexities of offshore operations and that offshore structures must be designed for extreme conditions, not average ones.


Friday, 11 September 2015

Doris - A thought experiment in progress (8) - The winter problem

Doris is a thought experiment running on a Raspberry Pi and a laptop which is intended to explore sustainable energy, an evolving description and discussion can by found in a previous posts:
It is important to remember that Doris is a computer simulation with some arbitrarily set parameters and rules, it exists only in the imagination and has no physical reality.

In most energy economies without a significant amount of storage, wind and solar generators are alternatives to those fueled by gas, coal etc.  When the sun does not shine and the wind does not blow (as sometimes happens on a winter's night in December or January), the sustainable sources drop out and gas turbine stations kick in.  Whilst this is not explicitly stated in energy policies, there is a in effect a duplication of generating capacities.  This causes a variety of problems which include grid management where both demand and supply are related to the weather and economic ones.   Investors in conventional generating capacity may not want to participate in a back-up system to a wind farm, they probably want a free standing investment.

Energy policies which attempt to have a degree of sustainability need to take account of the winter problem,  Typically, this the time of year when the demand for energy peaks.

Storage at the household and some grid management at the neighborhood level might make a contribution.  The graph below shows the daily demand for electricity as modeled in Doris, this is roughly 6.8 kwh/day scaled up to four household, the demand has peaks at the start of the waking day and in the evening.  Say, each household has 10 kwh of storage, it could "download" its energy for the day over a six hour period by imposing a load of just over 1 kw on the grid.  Resorting to the usual gross over simplification, if each household does this in turn, the demand is constant over the day and approximately 60% of the level that would be needed if storage was not present in the system.

The upside of this scheme is that the amount of conventional capacity required is reduced and that the efficiency of most plant increases if it can be run at constant load rather than spinning up to take account of a period of light airs or a surge in the demand for hot water for tea making or spinning down when the sun comes out.  Maybe, there is the need for some creativity in ways to channel investment in generating capacity into storage and energy management, this is a challenge but something worth evaluation.

A variation of this theme is the problem caused by solar eclipses.  A recent eclipse during which the sun was obscured briefly over parts of Germany, which has significant solar generating capacity required some planning to avoid grid problems resulting from a sudden loss of power followed shortly after by a rapid surge.

Load management within the household could help reduce the peaks and troughs.  From a limited and unscientific survey, most of the potential relates to cleaning operations.  In many homes, the daily routine is based on meal times and these are more or less fixed.  Devices like the washing machine and the vacuum cleaner can be operated at times which harmonize with the availability of energy, however, this does require some planning.  I am intrigued by the concept of a robotic vacuum cleaner which comes out of its hutch when the solar panels are producing a surplus of energy and sucks up the filth from the living room.

I'm no advocate for returning to the living standards of our grandparents generation when running a household involved humping coal and ash, washing and cleaning were hard, monotonous work.  But there was an appreciation of the seasons and the weather, if possible washing would be done on a "good drying day".


Wednesday, 9 September 2015

Doris - A thought experiment in progress (7) - Climate

Doris is a computer simulation designed to explore the use of sustainable energy by a typical household, it has no physical reality.

The post which describes the background to the project, also contains links to related posts.
The core functionality of Doris is the facility to make estimates of the output of wind and solar generators using aviation weather reports (Metars).  It is written in Python 2.7 and accesses historic weather data stored in an SqLite3 database.  The code is modified explore a range of configurations and scenarios, in this case climate.

When I first started seeking out data on wind and solar resources, it became apparent that  it was difficult to make like-for-like comparisons, this was largely due to variations in climate and terrain.  It's easy to look for an explanation in maths and stats, but a quick look through the travel section of a newspaper will provide an answer.  Many North Europeans take their holidays in Spain because of the clear skies and sunshine and few South Europeans trek north to in mid winter because of the wind and cloudy skies.  For wind turbines terrain is important, the ideal location for a turbine is on a ridge which is at right angles to the prevailing wind, when they are placed in valleys and urban areas they may not perform well.  Also the distribution over a country can vary considerably, for example in the UK, the average wind speed in exposed western coastal areas is higher than sheltered ones in the east. When comparing the experience of different countries, the variations in climate should be taken into account.

The base case for Doris is a location in the south of England (Koppen climate type: Cfb) with 1 kw each of wind and solar generating capacity.  The post "You have to do both" contains some discussion of a wind/solar based system might behave in this climate.

For this post, I've deliberately chosen some extreme and contrasting climates.  In the context of Doris, variations in climate come from the location which is used to provide estimates of clear sky solar irradiance, a crude model which provides some allowance for variations in cloud cover and weather reports from a local airfield.

The first graphic comes from a run where the base configuration was run with data from hot desert region (Koppen climate type: Bwh).  In this case, solar makes the greatest contribution to meeting the load, but at 35 deg. North of the equator, there is enough season variation to draw in supplies from the grid, the average wind speed in this place was low, so the yield from wind was low.

Based on the results from the base configuration, a possible adaption was to remove the wind generating component and double the solar capacity, the effect was to significantly reduce the draw down form conventionally generated sources.

At the other extreme is a northern continental area (Koppen climate type: Dfc) at a latitude of approximately 65 deg.  There is significant variation in the yield from solar over the year, this drops to zero in December and January, but provides a useful contribution in summer.  This arbitrarily selected location is not very windy and the contribution from wind even in winter is low resulting in a large draw down form the grid.

A logical adaption was to triple the wind generating capacity and halve the solar element, this still did not make a major reduction in grid draw down.

Since I have been studying sustainable energy sources, there is a recurring issue which might be termed the "winter problem".  In the northern hemisphere the demand for electricity peaks in the winter months whilst the supply can be low due to low solar radiance and periods of calm.  

Friday, 4 September 2015

Doris - A thought experiment in progress (6) - The Mix

Doris is a thought experiment running on a Raspberry Pi and a laptop which is intended to explore sustainable energy, an evolving description and discussion can by found in a previous posts:


It is important to remember that Doris is a computer simulation with some arbitrarily set parameters and rules, it exists only in the imagination and has no physical reality.

Whilst scribbling lines of code, economics have deliberately been pushed into the background, but the loose assumption has been that both solar and wind generating capacity (excluding ancillaries like storage, inverters and bits of wire) each cost £1k/kw and the that the total cost is within sight of £5k and a lot of inconvenient issues have been ignored.   The rules which have been used suggest that a load of 2,500 kw/year can be matched with 2 kw of generating capacity.  The base configuration pretends it has 1 kw of wind and 1 kw of solar.  Changing the mix of wind and solar gives different results.

The objective is to minimize the dependency on conventionally generated sources.  These comments relate to a temperate maritime climate (Koppen: type Cfb), different climates would result in different results.  For example a hot desert (Koppen type: Bwh) would get a better yield from solar due to the relatively minor seasonal variations and the absence of cloud.  Subarctic climates (Koppen type: Dfb)
would get a low yield from solar due to the low sun and short days during winter months, in these places wind might offer a solution.

The graph shows the results of the simulations in which solar accounts for 25%, 50% and 75% of the generating capacity.  The graph shows maximum monthly draw down from conventional sources (which usually in December or January)  The dependency on conventional sources is lowest when the proportion of solar to wind is 25%/75%, this is primarily due to the low yield from solar during the winter.


In these simulations, the load is constant throughout the year, this is not realistic as the load would almost certainly be greater in winter than in summer  Future simulations may introduce seasonal variation in load, this will probably increase the amount of energy drawn from conventional sources with the low solar configuration.

A somewhat different results when the annual utilization of sustainable sources is plotted, in this case the high solar configuration uses approx. 82% of the energy it generates.  This is in part due to the high yield during the summer.  In its current form, the code gives priority to solar sources, but it is not thought that this has a major influence on the outcome (this may be tested in future simulations).

Sunday, 23 August 2015

Doris - simulation, storage and sustainability (5) - Good and Bad Years

Doris is a computer simulation of household energy consumption designed to explore the relationship between storage and the consumption of energy from sustainable sources.  It exists only in the imagination and has no physical reality.  A description can be found here:
This page also has links to related posts.

Wind and solar powered generators are weather dependent systems, the data feed for Doris is weather reports, these are in real time on the Pi and historic on the laptop.  Climate is what you expect and weather is what you get.  In the UK our weather is influenced in turn by the land mass of continental Europe and the water mass of the Atlantic Ocean from which come a procession of depressions.  The result is a moderate, but varying climate.  The yield from Agriculture is in part influenced by the weather, for example in the period 2010 to 2014, the UK wheat harvest varied from approx. 12 to 16 million tons.

When I first became interested in sustainable energy, I started to seek out data on wind speed and solar irradiance and cycle around the town and local countryside with a wind speed meter, these exercises were undeniably instructive.  About the same time, I saw my house on Google Earth and became ashamed of the state of the garden.  I cleared the weeds, made an attempt to improve the flower beds and created a small vegetable garden.  This provides a small supply of misshaped vegetables of a quality that supermarkets refuse to stock .  It also taught me the relationship between sunshine and plant growth.  Beetroot grown in the partially shaded front garden are sad, weedy things, whilst those grown at the back in full sun are big enough to cook and eat, even though they are smaller than the imports from Spain and Egypt.  The seasons that shape a garden, also determine the output of wind and solar energy systems.  Solar panels have good and bad years, just like the harvests.

A useful piece of advice from a manager on whom I was inflicted, was "first make the code work, then make it work quickly".  Doris is still in the first stage and does not run quickly, so it had only worked through five years of data before I had to move on, ideally, you would need a much bigger sample to get an understanding of year-on-year variations, so this graph which shows the %age of energy taken from conventional sources only shows that there is year-on-year variation.


Some of the variation is due to variations in wind speed as shown in the graph below.  I have memories of the summer of 2013 as being sunnier than usual and this is reflected in the low dependency on conventional sources because of the increased output from solar panels under a clear sky.

Doris is intended to explore the response of a system which attempts to minimize dependency on conventional energy sources.  The output of coal and gas power stations can be varied to meed demand whilst that of sustainable systems is dependent on the weather.  In the 19th century, sailing ships started to be displaced by steam driven ones because they were more reliable.  The design of sustainable system need to be aware that the supply may be constrained.


Wednesday, 19 August 2015

Doris - Simulation, storage and sustainability (4) - You have to do both

Doris is a computer simulation of household energy consumption designed to explore the relationship between storage and the consumption of energy from sustainable sources.  It exists only in the imagination and has no physical reality.  A description can be found here:
This page also has links to related posts.

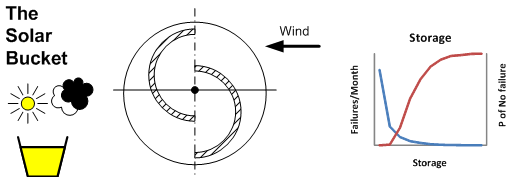
The current version of Doris is the third attempt to explore a sustainable energy system.  The first took place in 2007/8 which became known as the Solar Bucket.  This was simply a 4 watt solar panel connected to a small lead acid battery, during the day the panel charged the battery which was then used to support some form of load overnight, the most useful being an LED light.  The Solar Bucket worked OK during summer and less well during winter.  One of the lessons of this exercise was the effect of clouds on solar devices.  The second attempt was in 2013 which used the output of an imaginary wind farm to charge a bank of Ni-MH cells, if the make believe wind farm did not produced enough electricity, it kept itself alive using an old mobile phone charger.  This version ran erratically during the winter of 2013 and again in the spring of 2014.  The behavior of this system can be summarized as alternating between a few days on wind power and a few days hanging on the phone charger.

I took away two lessons from this experience, first that messing with hardware is a fun, but a slow way to explore a concept and a software emulation would be more efficient (and cheaper).  Secondly, for the location where I live which has a temperate maritime climate (Koppen type Cfb), a system which attempted to minimize dependency on conventional sources would probably need to utilize both wind and solar sources.

The graphs below show the result of three runs of Doris using historic data for 2011 using the base configuration with 10 kwh of storage and an annual load of 2,500 kwh.  In the first, the system has access to both wind and solar sources.  In its current form, Doris gives priority to solar energy, so the combined graph is biased towards solar and a different set of rules would give a different outcome, but it gives an indication of the direction of travel.

In this configuration, the peak demand for conventionally generated electricity is approximately 30% which can take place more or less anytime except summer.  When access is restricted to wind energy alone, the peak demand for conventional energy rises to 55% in summer with significant amounts being needed throughout the year.

In the solar only configuration, the dependency on conventional sources rises to 90% in winter, but less than 10% in summer.


As with all simulations, the output reflect decisions about the inputs.  for example, different results could be obtained by increasing the access to solar energy.  This would provide a surplus for export during the summer months with less dependency on conventional sources in winter.  The base configuration for Doris is loosely based on a 1 kw solar array (four 250 watt panels) and 1 kw of wind generating capacity.  The location of the wind capacity is assumed to be at a prime location.

History: originally posted on 19-Aug-2015 and revised 24-Nov-2015.

Images: blog_116


Monday, 17 August 2015

Doris - Simulation, storage and sustainability (3) - Storage Sensitivity
Doris is a computer simulation of household energy consumption designed to explore the relationship between storage and the consumption of energy from sustainable sources.  It exists only in the imagination and has no physical reality.  A description can be found here:
This page also has links to related posts.

The base configuration for Doris is a household which consumes 2,500 kwh/year.  It is connected to the grid and has access to electricity from conventional, wind and solar sources.  In the base configuration (config 3) there is 10 kwh of storage.  Follow the above link for a more detailed description.  Incorporating storage into the household energy economy makes it possible to get a better match between the availability of electricity from weather dependent sources and the regular pattern of demand which comes from sleeping, work, college and preparing meals.

The proportion of sustainable energy consumed by a household from the grid is roughly 10 - 15% but on any given day this might vary from zero to 20% depending on the season and the prevailing weather. If a household has an element of storage, this might increase to 50 - 70%.  The Doris model assumes that the household has direct access to wind and solar sources, thus the output is not comparable to data from the national grid.

Obviously the the greater the amount of storage the better, but there are also economic constraints and this series of runs was intended to see where the law or diminishing returns set in with the objective of defining the base configuration.  As with any simulation, the output is determined by the assumptions used in the model and as there are many combinations, the graphs below only indicate the direction of travel rather than precise forecasts.

 The rules used by the Python 2.7 code give precedence to solar sources, if no solar generated electricity is available it then checks to see if there is any which has come from a wind farm, if insufficient power is available, the demand is met from storage and when this is exhausted if falls back on conventional sources from the grid.  Any surplus sustainable energy is used to recharge the storage.

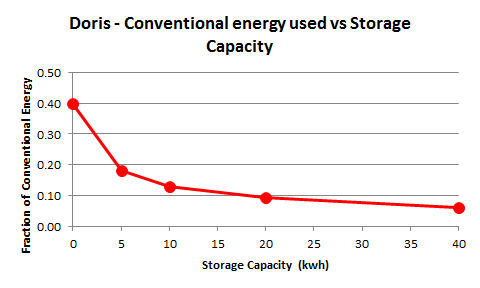
The storage capacity affects the consumption of wind and solar sources differently.  The availability of solar sources is based on a 24 hour cycle with significant variations resulting from sun-earth geometry and cloud cover, thus diminishing returns set in with around 5 kwh of storage.  Wind energy tends to come in pulses a few days apart and the consumption of wind generated electricity increases with increasing storage.

The graph below shows that the proportion of energy from conventional sources falling as the storage capacity increaes.

Bases on these runs, the storage capacity for the base configuration was arbitrarily set at 10 kwh.  This is thought be a reasonable balance between cost and performance and there are available products for this capacity.

Note

This is a simulation, not real life.  This post was originally published on 17-Aug-2015 and substantially revised on 23-Nov-2015.


Friday, 14 August 2015

Doris - A thought experiment in progress (2) - Energy Delivery

Doris is a computer simulation designed to explore the use of sustainable energy by a typical household.

The post which describes the background to the project, also contains links to related posts.
The core functionality of Doris is the facility to make estimates of the output of wind and solar generators using aviation weather reports (Metars).  The version running on the Raspberry Pi runs the base configuration and uses a live feed from NOAA, but the same code can be fed with historic data which makes it possible to explore a range of configurations and scenarios.

Wind and solar sources are weather dependent energy sources subject to seasonal variation, this distinguishes them from fossil/nuclear plant whose output is controllable.  Storage and diversity helps to match supply and demand.

The first graph shows the estimated breakdown of energy sources for a configuration with approximately one day's storage.  There are several things happening in this graph, the first is the seasonality of wind and solar sources.  Solar works well during the summer months, but makes little contribution during the winter.  Another issue is the constraints on the amount of energy that the system can import, these have been set at low levels and may restrict the amount of energy that can be stored.  During the winter months, the system falls back on to the grid more than is desirable. This is partly due to the differences in the pattern of delivery from wind and solar sources.


Wind energy comes in pulses at intervals ranging from a couple of days to a fortnight.  In winter during the calm periods, Doris maintains it's imaginary load from the grid.
In contrast the delivery of solar energy is regular, within a given month the greatest variation comes from variations in the nature of the cloud cover.
A relatively small amount of storage will provide a reasonable match between supply of solar energy during the summer and the load it is maintaining.  It is probable that a much larger storage capacity is needed to meet a constant load from wind sources.

The next step is to run a sensitivity analysis on the amount of energy taken from the grid and the storage capacity of the system.