Pages

Showing posts with label storage. Show all posts

Monday, 7 March 2016

Simulation and Sustainability (15) - Think differently

In the second half of last year I wrote a short and simplistic simulation in Python designed to explore ways in which a typical household could increase its consumption of wind and solar energy by the including storage in it's energy economy.  Several scenarios where explored and written up as posts as part of this blog, this one is some thoughts on the project. The link at the bottom of the page points to the original posts.


The concept is simple, a household has, say, 10 kwh of electrical storage and by some yet-to-exist technology which gives it the ability to "buy" electricity from a variety of suppliers.  It makes use of  sustainable energy  when it is available and if there is a surplus stores it for use when the sun does not shine (i.e. at night) or when the wind does not blow.   It first checks to see if any solar energy is available on a local grid and if none is available it sees what wind farms can offer and finally when the storage is exhausted, falls back on conventionally generated supplies.

As with many simulations, there are a lot of assumptions and arbitrary rules, so the conclusions suggest a direction of travel rather than precise estimates of how such a system might behave.  Renewable currently account for roughly 15% of the electricity consumed in the UK, by incorporating storage into a home's energy system, an individual house might increase this to 50 - 80%.

Whilst wind and solar generation are critical technologies in a sustainable energy economy they are both weather dependent sources and require either storage or a  backup in the form of gas fuelled power stations to bridge the gap between intermittent supply and regular demand.  The pattern of investment that seems to be emerging is that offshore wind farms are incremental to conventional capacity and this raises the question: "Is it possible to displace some fossil/nuclear capacity by increasing the use of energy storage".

When I first started thinking about a simulation to explore this idea I had in mind the lead-acid battery packs used by fork lift trucks, however, since then products like Tesla's PowerWall have become available and these have the advantage of being packaged as consumer products.  As electric vehicles become more common, the profile of electrical energy storage will become more familiar.  It also raises the possibility of using the family car as part of the household energy supply.  For example, most cars do very little, often sitting around car parks at the end of the commute, if during that time, the car is charging itself on wind or solar generated electricity, it might return home with a surplus which can be used to light the home and cook the evening meal (I appreciate there might be some complexities in this scenario).

The current electricity supply model has evolved on two assumptions:
  • That supply and demand can only be synchronized by adjusting the output of generators
  • There is no limit to consumption
If these constraints are relaxed, alternatives forms development emerge.  Storage helps with the first item and the second is a challenge.  People do not buy energy, they purchase the benefits it provides.  One example of a technology which delivers this is LED lighting.  A decade ago our home was lit with incandescent bulbs and it consumed 20 kwh/day, now with LEDs we are down to 4 kwh/day and we can still see to read.

The potential to re-apply investment in energy infrastructure is illustrated by a hypothetical nuclear power station.  Say it costs  £20 billion and several years to build a 2,000 MW unit.  If the average home consumes 4,500 kwh/year, this imaginary project with a load factor of 90% can supply approximately 3.6 million homes.   This very simplistic calculation suggests that one power station represents an investment of £5.5k/household.  This is similar to the cost of a 10 kwh storage unit.

Sustainable energy sources are unlikely to fully replace conventional ones but there is scope to investigate some alternatives.

This link provides a description and pointers to related posts:


Sunday, 19 October 2014

Storage - A personal survey

Having made frequent references to storage in this blog, I thought it would be good to read around the subject, this post is more or less a list of links to Wikipedia articles.  The list is neither complete or comprehensive.  Whilst randomly clicking around, I was intrigued by the number of references to submarines and electric fork lift trucks.  Whilst these appear to be diverse applications, both make use of stored energy and both have well developed infrastructures to support their operations.  Maybe the starting point of a sustainable energy economy is a submarine, maybe this was the origin the line in the Beatles song which goes "We all live in a yellow submarine".  Storage is the key technology in a sustainable energy economy, generation is the most visible element and attracts most of the attention, but it is storage that bridges the gap between the regular pattern of daily life and the shifting sun and fickle wind.

Traditionally, system efficiency has been principal method used by engineers to assess performance.  Whilst it is not unimportant in storage systems, in the authors opinion it is the unit cost of energy as perceived by the end consumer which is the most important measure.

Batteries

Batteries are the most familiar form of storage.  A gross over simplification would be to divide them into two categories defined by weight, the heavy lead acid form which has been in use for a century of more and the lightweight varieties such as NiMH (Nickel Metal Hydride), Ni Cd (Nickel Cadmium), LI (Lithium Ion).  Lead Acid accumulators have a long history of use in domestic energy storage providing the energy for lighting, door bells and valve radios.  If operated conservatively they have a long life and can provide a few kwh for domestic use and more than 1,000 kwh for submarines.  If used in vehicles, the result is the milk float, the high energy density of LI batteries makes it possible to design sleek and elegant high performance vehicles such as the Tesla Model S which has LI batteries with capacities of 60 - 85 kwh.  The life of a battery is a function of the way that it is used, high charge and discharge rates will shorten the life of most types of battery, the depth of discharge is also a factor.

Compressed Air

Compressed air motors have long been used to provide power where any form of combustion is undesirable, for example in mines or where atmospheric oxygen is not available.  Compressed air powered many torpedoes in both the First and Second World Wars.  Storage schemes using compressed air range from small pneumatic accumulators to utility scale projects based on underground caverns. Large marine diesel engines often use compressed air for starting.  At the time of writing, it seems that most of the utility scale projects are still at the proposed or planning stage.  Compressed air storage based on underground caverns maybe less visible than the major civil engineering works required for pumped water systems.

Pumped Water Storage

Pumped water storage is a utility scale technology, often based on worked out quarries and large dams.  The system consists two reservoirs, an upper one and a lower one.  The energy to be stored is used to pump water from the lower reservoir to the upper reservoir.  That energy is reclaimed by letting the water flow back to the lower reservoir through turbines which power generators.  Often the machinery is in the form of units which can  work as either motor/pump sets or turbine/generators. Pumped water is currently the most common utility scale storage technology.

Thermal Storage

Thermal storage includes several diverse range of technologies.  At the domestic level it includes night storage heaters, these use off-peak electricity to heat up a mass of bricks or water, as these cool during the day they provide space heating.  Domestic hot water systems often incorporate an insulated tank, this can be heated using off-peak electricity or solar thermal devices in a suitable climate so that hot water is available for an early evening bath.  At the utility scale, heat from large solar concentrators has been used to create a reservoir of molten salt (or similar substance).  The heat stored in this material can then be used to create steam for use in a conventional steam turbine generator.  The Wikipedia article has a link to an article describing a solar basede Seasonal Thermal Storage System in Canada.

Hydrogen

Whilst hydrogen is not a dedicated storage technology as such, it can be produced by sustainable sources, for example by electrolysis from wind generated electricity.  It is a versatile fuel and can be used to generate electricity directly in fuel cells and as fuel for reciprocating engines which are adaptions of those used in automotive applications.  The German Type 212 submarine uses a form of hydrogen fuel cell to achieve better performance and endurance than a conventional diesel electric vessel.  Earlier this year Toyota announced the launch of fuel cell based car.

Flywheels

Flywheels have long been used for storing energy for very short periods of time, for example smoothing out the torque produced by reciprocating internal combustion engines.  It maybe an urban myth, but success of the Citroen 2CV (the famous "tin snail") has been said to be due to a large flywheel which made it well suited to undulating roads of rural France.   Flywheels form the basis for for some recuperative braking systems, these capture a vehicle's kinetic energy as it brakes and then restore it to the drive train on the next acceleration.  This type of system has been used in F1 racing cars.  The flywheel is an attractive energy storage device, it may have a longer life expectancy than chemical based systems.  Despite its apparent simplicity, large systems are heavy, high rotational speed systems which present some design challenges, however, it seems that these are been overcome.

Links

Batteries
Milk Float
Tesla
Compressed Air Storage
Pumped Water Storage
Thermal
Type 212 Submarine
Hydrogen Storage
Hydrogen Fuelled Vehicles
Flywheel Energy Storage
Regenerative Braking


Friday, 2 May 2014

Storage - A Bonus Technology

My first encounter with storage was whilst working as a paint sprayer and shot blaster in a factory using batch production.  The shot blasting part of the job involved hanging on to a hose gushing compressed air and ground up cast iron whilst wearing a rubber suit in a steel booth.  The compressor was too small to power the blaster alone, so it charged up a pneumatic accumulator which took an hour or more to fill and provided enough air for ten to fifteen minutes blasting, which is about as long as you want to wear a rubber suit.  This fitted in well with the other production tasks because it generally took an hour to organise the work, engage in an exchange abuse with the welding station upstream and drink milk.  The Factory Act required that the blaster/painter was to be supplied with one/two pints of milk per day, this was a form of discrimination against vegans.  A critical part of the job was managing the accumulator because blasting and painting were at the end of the production process a lack of planning could put the weekly bonus in danger.  This was the dirtiest job I've ever had, but it paid well and gave me the funds to go to college, so I'm deeply grateful for it.

The next encounter was more analytical and was related to offshore oil production.  It was an attempt to derive a relationship between crude oil storage volume and loss of offshore production due to bad weather.  Small offshore oilfields which are remote from a pipeline are often developed using a drilling/production platform which exports its oil to a tanker moored to a nearby buoy.  In calm waters, production is more or less continuous, there is a brief shutdown whilst the full tanker is disconnected from the buoy and and an empty one takes its place.  However, in harsh environments where the wave height can be too high  to allow safe operation, the tanker has to disconnect in rough seas and stand off until the weather improves.  Introducing an element of storage into the system allows the platform to continue production when it would otherwise have had to shut down.  The sketch shows the main elements of the system.


By combining wave height data collected from offshore buoys in the region with the operating limits of the mooring buoy it is possible to suggest a relationship between the storage volume and production lost due to bad weather.  This in turn can be combined with estimates of the incremental cost of storage to keep an economist off the streets  for a considerable time.

Storage is a key element in sustainable energy system, wind and solar are non-continuous resources and it is desirable to be able to store energy when it is available but not necessarily wanted.  The classic example is using a battery to store the yield from solar panels for use in lighting the house after sunset.  In the UK the peak demand for electricity occurs early evening in winter, this drops off after midnight, even a relatively small volume of storage, say, less than 5 kwh/household would smooth out demand and ease the integration of wind and solar resources.  At present, the government is providing a subsidy of £5,000 to the buyers of electric cars (storage on wheels), I'm reluctant to criticise anything that might have an environmental benefit, but it would be an interesting exercise to consider what the benefits would be to providing support for storage in commercial and domestic buildings (storage without wheels).  If done carefully, this to, could act to stimulate industry.

I'm maybe stretching a point with this analogy, but the concept of domestic energy storage is not new.  Many Victorian and Edwardian houses had some form of coal storage, traces of which can be still be seen, especially on the streets of London where manhole covers like this are still visible.

The designs can be elaborate with the maker's name worked into the artwork, sometimes with a patent number.  Now the space below the manhole is most likely to be used as a kitchen or utility room, but at the time the house was built it might have looked like this:

Depending on the size of the house, the coal store might have held between one and five tons of fuel.  This form of heating required the householder to be aware of the seasons, coal would be cheaper during the summer, but in winter when all the open fires were in use, the price would rise, so the prudent housewife would want to start the winter with a good stock.

Alongside the coal store in a cool part of the house, there might also be food store or larder.  Not every pre-war housewife dedicated August and September to jam making, bottling and preserving the harvest from the garden, but these seasonal activities were lurking somewhere in the culture.


Friday, 28 March 2014

Timing is everything

A common measure of sustainability is the percentage of energy generated from renewable resources such as wind, solar, tidal, hydro, bio-mass etc.  Often the time period on which this statistic is estimated is a year.  Equally important is the timing of supply and demand.  The classic example is solar generation, the graph below illustrates the demand for electricity on a typical spring day and the solar irradiance available to contribute to meeting it, a similar graph could be drawn for wind and the time period extended to include seasonal variations.

The two ways of meeting the overnight demand are storage and alternative means of generation.  Most energy economies are evolving to adapt to diverse means of generation.  At the present time it is hard to make a good case for storage as most energy economies can absorb what wind and solar installations can offer them and frequently, they are given priority when working out how to meet demand.  In general, there are few surpluses of energy which can be accumulated in a storage system, even if such a system is available.  I don't have a handle on the relative risks and economics of utility scale storage and generation, but at a guess, maintaining a fossil/nuclear generating capability is the "low" risk option.  The approach makes wind and solar sources incremental parts of the energy mix which need backing up with an equivalent amount of conventional capacity.

The case for storage is that it is a step towards sustainability.  At its most basic, the harvest from solar panels during the day can be stored and used to keep the lights on after dark.  Within the arid regions towards the equator, where there a clear skies and relatively small seasonal variations, this could be a workable scenario.  In the temperate regions, more complex system are needed with a mix of solar and wind.  Solar works well in summer, but the winter yields are low, wind works better in winter and on some days neither produce very much.

I'm currently messing with a very small scale storage project in which a small computer attempts to keep itself alive by "buying" sustainable energy, this could be done as a computer similar (which is happening as a parallel task), but the having some hardware, makes it both fun (other relevant words are frustrating and expensive) and more instructive than a bunch of numbers from a computer programme.  There in one economic nicety, you can attempt to use off-peak electricity which is approx. 7p/kwh where possible in preference to normal daytime rates which are close to 20p/kwh.  If you used this approach to ensure that a high proportion of the electricity you use was from renewable resources, you would have some capital and operating costs beyond those normally associated with turning the lights on.

Living next to a railway station used by commuters, I've become aware that there are an increasing number of electric cars around, typically, these are priced at around £20k after a £5k government subsidy.  Apart from their high cost, electric vehicles charged by off-peak electricity are an attractive concept, in effect they are storage on wheels.  An interesting policy study would be the  effect of providing similar support for including storage into homes and offices.


Friday, 20 December 2013

The Winter Solstice

This is was written a few days before the Winter Solstice when the day is short and the Sun is low in the sky.  It is the time of the pre-Christian festival of Yule, regardless of one's religious beliefs, this is a time of year when the spirits need lifting from the cold and damp with parties and festivals.  At present I feel a strong desire to keep warm by setting fire to something that died a few million years ago.

Most religious festivals are linked in some way to the land and climate in which they are celebrated, for example, Candlemas (Feb-2) coincides with the time the soil starts to warm after the winter and Easter marks the start of the growing season and so on.  Whilst these events were once marked in some way, we increasingly isolate ourselves from seasonal variation with central heating in winter, air conditioning in summer and strawberries in November.  This process started with the large scale use of coal at the start of the Industrial Revolution around 1750.

The graph shows the estimated clear sky irradiance over Southern England at the time of the solstices and the equinoxes.  The energy yield at each time is proportional to the area under the curve, or to put it another way, its cold in winter and warm in summer.  It is possible to do similar things with wind.

We are an urban and industrial society and there is not going to be a return to the rural idyll (if it ever existed) any time soon.  Yet understanding and appreciating the climate and economy in which we live can lead to good designs and better decisions.  The sustainable energy economy is a big challenge and it is important to realise what can be achieved.  Industrial and urban economies need continuous supply of energy, part of the base load created by street lighting, transportation, schools, hospitals, data centres, pub signs etc..  I suggest that there is little public support for a railway system powered solely by wind turbines.  Sailing ships were displaced by coal fired steamships because they could run to schedules and were big enough to accommodate all who could afford to travel.  This base load will be underpinned for the foreseeable future by fossil/nuclear generation. Within that sector of the energy economy, the key elements are conservation, management and storage, implementation of which is not helped by legacy systems.

I'm embarrassed to admit it, but some of my interest in sustainable energy was sparked by the 1970s BBC TV series "The Good Life" in which an attractive young couple unimaginably named Tom and Barbara Good, but played endearingly by Richard Briars and Felicity Kendal attempt self-sufficiency in Surrey.  Needless to say the challenge was a rich source of humour.  My wife is too well grounded to let me indulge in such fantasies so I have contented myself with a paper project to provide 1 kwh per day from renewable sources without costing the Earth.  Whilst pondering this problem, I have learnt how to mount transistors in TO 220 cases, a little about controlling them with a computer, but I'm still struggling.  My backyard almost makes us self-sufficient in garlic and provides a small supply of vegetables of the type normally discarded by supermarkets but as a source of wind and solar energy it is a sad disappointment.

The path of helium filled balloons which have escaped from young partygoers suggests that at around 500m there might be a steady wind, but the neighbours, tolerant in many ways would not accept an airborne wind turbine.  A boat on a river estuary might work, but my wife is too well grounded to let me indulge in fantasies.  The obvious solution is to buy electricity from people who generate it from wind, solar and other sustainable sources and use the grid as a delivery system.  But energy from these sources is a natural product whose availability changes with the seasons.


Thursday, 12 December 2013

How do you learn about this stuff?

I first became interested in sustainable energy around 2005.  This was before the financial crisis of 2008 when environmental issues were aspirations, not perceived as costs (maybe I exaggerate).  A 2.5 kw rooftop PV installation cost between £15k and £20k and there were no feed-in-tariffs, not surprisingly there were not many to be seen.  DIY superstores were selling 1 kw wind turbines for around £1,500 (I think) and there were stories in the press expressing horror at the low yields, this was not surprising considering that rating was usually for wind speeds around 15 m/s (approx. 30 mph), whilst this is not a gale, its the sort of wind you don't feel too often (for which many of us are grateful).  I struggled to understand this stuff.

Most of my working life I've been lurking in the shadows between technology and economics.  A traditional engineering education did not include economics and the attitude towards its practitioners was illustrated by graffiti  in engineering faculty toilets above the loo roll dispenser which read "Economics degree, please take one".  However, there was an implicit understanding that there should be a link between technical performance and economic benefits, however dubious.

My perception of wind and solar energy systems is that they are conversion devices, the input is "weather" e.g. wind, sunshine, cloud etc. and the output is electricity or heat.  Attempting to understand this relationship has led to the combining bits of wood, drain pipes, Meccano and a sketchy knowledge of electronics into experiments.  I realise now that I must have been a sad disappointment to those burdened with teaching me carpentry, metal work and technical drawing, be grateful that I trained on aircraft engines and did not become a kitchen fitter.

My first attempt around 2007 was the "Solar Bucket", this consisted of three components, a small solar panel, a lead acid battery and several devices to use the energy harvest, the most useful being an early LED light.  The photo shows the panel on a winter's day.


This provided some valuable experience.  It illustrated seasonality, the effects of clouds and much more.  The battery component was originally intended as a measurement device.  I was a little slow to realise it but the battery was the important component, storage is a key element of a sustainable energy economy.  I've heard several people say things like "I want solar panels to make me independent of the energy companies" (or variations n the theme), but the Sun does not shine at night, so without storage they are as dependent on fossil/nuclear fuel as the rest of us.  I argue that investment in energy storage would give a better outcome than more rooftop PV.  As I write this I am staring at more plywood, batteries and wires designed to act as a realistic load for energy management software.

Instructive as the "Solar Bucket" was, it did not act as a resource meter.  This resulted in several attempts at making radiometers.  Initially, these used light dependent resistors and did not work, as these are successfully used in cameras and other devices, the problem was my lack of knowledge.  At some point I purchased a batch of small, flat monocrystalline PV cells for about £1 each and these work well.  The current device could be described as a shaded radiometer and for some reason it attracts the attention of dogs.  The concept is simple, a horizontally mounted cell measures global irradiance, then a shade is placed between the sun and the cell, it then measures diffuse irradiance.  Combine these two measurements with Sun-Earth geometry and you can get an estimate of the direct beam irradiance.

I'm trying to estimate the accuracy of this device, but it suggests that the water content of the atmosphere has has a significant effect on irradiance and particularly diffuse irradiance.  There are some good models of clear sky irradiance, but some of these require data which is not readily available or are related to the climate in which the observations were made, this is an attempt to understand my own back yard.

The first radiometer was simply a PV cell shorted with a resistor, the current and therefore the irradiance was measured by measuring the voltage across the resistor with a multimeter.  For several months, I took readings with the cell horizontal with it angled at approximately 50 degrees to the horizontal.  Under a clear sky, pointing the cell in the direction of the Sun increases the output, this maximises the yield of solar devices in summer, but in winter, the English sky is often full of thick stratus cloud, on these days, the output of the PV cell was greatest in the horizontal position.  The object below was constructed to explore this further.


It consists of a light dependent resistor mounted at one end of a length of waste pipe which is mounted so that measurements can be made around the sky's hemisphere.  On an overcast day, the diffuse irradiance was equally distributed about the the sky, whilst on a clear one it was principally from the direction of the Sun.  This suggests that the yield from PV devices in an English winter might be maximised by mounting the panel horizontally.

My home is located on the western side a a valley in an area where the prevailing wind is from the south west, so we are fortunately sheltered from much bad weather.  Whilst solar is a back yard technology, observing the wind means leaving the house.  A lot of wind speed data is collected in clear open space such as airports, offshore buoys and weather balloons.  The data from these sources often relates to the flow of air over a relatively smooth surface and can have little or no relationship with the wind in nearby urban or rural environments.  In these places, the wind eddies around buildings and trees and neither the speed or direction is constant.  In this type of environment, vertical axis wind turbines offer some advantage.  I horizontal axis machine in an urban setting will often "hunt" for the wind, by the time it has aligned itself with the flow, the gust has dissipated.  I was first introduced to the Savonius design by a university friend from the Caribbean, whilst we were taught about marine, automotive and aircraft engines, simple devices for working irrigation pumps got little or no attention.  The Savonius device has two attractive features, the first is that it is not subject to the complex forces seen in other vertical designs, the second is the ease of construction.  In the West Indies they are often made by cutting a 40 gallon oil drum into two, then welding it back together so that it looks something like the model in the photo below.

A few happy days were spent cycling around the city and taking this model to the top of multi-storey car parks, to the end of breakwaters  and occasionally attracting the attention of dogs.  If you are a man wanting to attract women, borrow a puppy, if you want perfect solitude get a model wind turbine.

I did spend some time messing with a dynamometer for the Savonius model, but abandoned it when I realised that I would have little use for the data.  The Meccano tower lingered in my work room reminding me of the value of time.

What have I learnt?  The main lesson is that a sustainable energy economy is complex, its not just a case of shutting down nuclear power stations and seeding the countryside with wind turbines and putting a solar panel on every roof.  Its a blend of realistic expectations, generation, management and storage which is a large technical challenge, but so was developing the technology for nuclear power stations so we've been here before.  Also don't ignore economics, there is a belief held by some well meaning people that sustainability is above economics, one man's feed-in-tariff is another man's economic cost and this does not lead to good decision making.

Its quite possible to do a lot of experiments with limited resources.  The basic rule is to make mistakes cheaply and realise when you are wasting your time.  I put a lot of effort into a solar thermal device, this had a collector area or half a square metre, looked quite impressive but was useless for anything other than drying washing.  A series of small panels each 10 cm square cost very little and were quite instructive.


Friday, 6 December 2013

Wind is Moving Gas

A recent review of an electric car could be summarized as "This vehicle is not petrol driven".  Like a lot of things energy related, electric vehicles are not a simple swap from an old technology to a new one.  I have never owned or driven an electric vehicle so this is a framework which I might use to evaluate one, a sort of automotive lit-crit.


Most reviews of electric vehicles focus on range anxiety, at a guess this is more do with opportunities to re-charge than the distance/charge, typical numbers seem to be in the 100 - 200 km range.  I live in an area of controlled parking which is next to a railway station.  A statistically invalid survey of the parking permits of the vehicles in our road, suggests that 40% have travelled less than 1 km and that the remaining 60% have travelled less than 5 km and are parked in a garage or driveway at night.  The record shortest journey is 150 metres.  Whilst many of these vehicles are capable of crossing continents, most don't.  Whilst I have not lived in the US, I have spent a lot of time working there driving the American Dream (a.k.a. a Dodge Neon), even with a full schedule it was rare to travel more than 150 km in a day.  so with the significant exception of family holidays and trips to granny, range for many people is not an issue.

Cost is harder to deal with.  Half an hour of Googling and doing things with a pencil resulted in the following conclusions, first that electric cars are expensive to buy and secondly if charged up on-off peak electricity, cheaper to run.  What that does for my wife's 40 km commute is not obvious.

A neighbour recently described me as an "eco" because I rarely drive and prefer my bike, but I'm male and therefore lust after low slung sports cars (although my car-boot bike maybe quicker around town, sadly, beyond the city limits its not a contest).  I might drool over a Tesla.

I dispute the claims that electric vehicles produce zero emissions.  In the UK electricity is produced from a variety of sources including coal, gas, nuclear, wind and solar, last time I looked, CO2 emissions were around 0.4 to 0.5 kg/kwh for the country as a whole.  The environmental issues are at the point of generation not the car.  The fuel for electric vehicles is coal, gas, nuclear, wind and solar rather than petrol.

In the context of a sustainable energy economy, electric vehicles offer personal transportation using renewable sources such as wind and solar.  Equally important is that they are mobile storage devices.  A typical car spends 5% of its time on the road and 95% waiting to go somewhere.  Wind and solar sources produce energy at the whim of the weather and fossil/nuclear sources are most efficient at a constant load, this is why off-peak electricity maybe half the standard price.  The storage capacity of electric vehicles could be used to improve energy management as a peripatetic part of a smart grid.

At present, the case for electric vehicles is not proven, a situation made more complex by the availability of subsidies.  Subsidies are a good economic tool to bring about change, but they can also be proof of the doctrine of unforeseen consequences.

A not to close look at the electric vehicles on offer suggests that they "not petrol driven".  As electric vehicles are a new technology, maybe the starting point should be elsewhere.  A few times when I have been meandering through the countryside I have been overtaken by a golf buggy.  These vehicles cost around £4,000 (I think) and have been adapted for use on the Moon, so making them fit for the daily commute should not be too great a challenge.  A vehicle costing £5,000 with low running costs and a range of 200 km would be the car most people need, but maybe, not the car they want.  However, make a low slung version with good curves and you have a Sinclair C5 - Who said they were a bad idea?

Safety on the roads is an issue and the ability to survive a collision is important, once you have been in accident, this is not an academic concern.  Much as I love my bike, I am acutely aware of it's vulnerability and I nag my children to wear cycle helmets.  The city I live in is flirting with 20 mph speed limits, does a 20 mph environment offer the potential for lighter vehicles?

Postscript

After I finished this post, I saw an innovative electric trike, driven by a combination pedals and an electric motor fuelled by four lead acid batteries and a Mars bar.  I gave chase, but quickly lost contact before I could ask the owner's permission to take a photo.


Friday, 25 October 2013

Energy Storage and Vegas Values

Energy storage is the buffer between supply and demand.  Wind and solar sources are weather dependent systems whilst home and work life tends to follow a more or less predictable routine.  Whilst the ancient mariner or miller might have taken a duvet day when the wind was not blowing, the office worker is expected to be at his/her desk when the weather outside is fair or foul.  Storage is a key component in renewable energy systems.

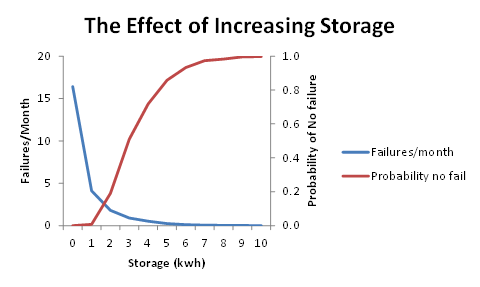
Monte Carlo simulation is one way to explore the interaction between supply, demand and storage.  The concept is simple, you throw random events as a mathematical model and see how it behaves, whilst this may sound abstract, its more than a bit like real life.  The name was comes from the roulette wheels in the casinos of Monte Carlo in the 19th century, in a fair and decent world, these devices are true random number generators.  If the technique was being named today, it might be called Vegas Values.

The example is based on a simplistic model of a system with three components, a small wind turbine, battery storage and a load. The example has been set up such that the average supply and demand are both 1 kwh.day, however, the distribution of  the supply and demand are different, and it is probable that on any given day, supply and demand will not balance. There could be large demand for energy on a calm day or little demand on a windy one. The inclusion of storage in the form of a battery helps match supply and demand. In this example, we want to understand the effect on system reliability for different amounts of storage.


Over a given 30 day month, the wind turbine produces an average of 1 kwh/day, this supply is assumed to be a triangular distribution with a minimum of 0, a  mode of 0.5 and maximum of 2.5 kwh. This supplies a 100% efficient battery, the capacity of which subject of the simulation. The model was run with storage capacities ranging from zero (no storage) to 10 kwh. The load is also 1 kwh/day and also modelled as a triangular distribution, the minimum, mode and maximum values are 0.5,1.0 and 1.5 respectively. The system "fails"; when the battery cannot supply the load. The parameter of interest is the number of days per month the system fails, which can also be expressed at the probability of the system not failing during the month.

The core of the model is shown in the flow chart:


This is a very simplistic model, so a single function is used to return a triangularly distributed random number, the arguments being the minimum, mode and maximum values. The Python code for this simulation can be found on our website. The principal variable is "storagesize" which is the capacity of the battery in kwh. The output of the program was used to create the graph below.

This simplistic model of a hypothetical system suggests that increasing storage reduces the probability of system failure but at the amount of storage increases, the law of diminishing returns set in.

Related Material

Monte Carlo Simulation

Triangular Distribution

Friday, 20 September 2013

The Fickle Wind and Shifting Sun

The energy input to wind and solar devices

Wind turbines and solar panels are energy conversion devices.  The input to these systems is not constant, it changes with the seasons, the weather and the time of day.

Comment 
   
This work has not been reviewed, thus it should be treated as a discussion not a description.

Wind

Wind is the result of uneven heating of the Earth's surface, in addition to climate, the airflow over any given location will be influenced by terrain. There can be significant variation in the wind experienced by places only a few kilometres apart. Whilst wind is often described in terms of velocity and direction of travel, it can be useful to consider it in terms of  power. The wind power available for conversion by a turbine is related to the cube of its velocity.

Power = area * density * velocity/ 2

A small increase in wind speed represents a large increase in energy, for example wind blowing  at 8 m/s has more than twice the energy than at 6 m/s.

By setting the area equal to 1 square metre and approximating the density of air to 1.2 kg/m3 and  converting the units to kw, the formula reduces to:

Power = 1.2 * Velocity3 / 2000

Comparisons based on this formula should be treated with caution. The density of  air falls with increasing altitude, for example it is close to 1.0 around 1,500m. The height of the observation above ground also has an influence, for a few  hundred metres above the surface, the wind speed increases with height above ground as the effect of friction reduces. The power of a wind turbine is substantially less the value given by this formula as only a fraction of the energy is extracted.  The fraction of the energy extracted at any given time is known as the  coefficient of performance, typically this is in the range 0.1 to 0.4 and may vary according to the wind speed.

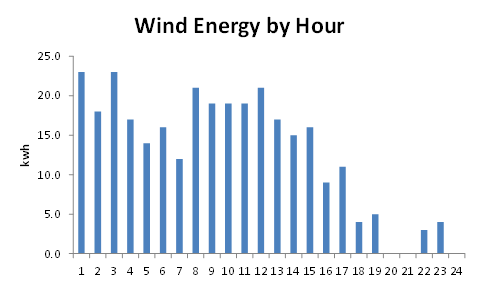
If enough data is available, then estimates of power (the rate of doing work) can  be used to make an estimate of the wind energy passing over the point of observation during a given time period.  The graphs below are are based on a randomly selected location and are an estimate of the wind energy by month, day and hour.

The first graph shows the cumulative wind energy broken down by month, In this example, there is significant seasonal variation, this may vary with climate.  In Western Europe peaks in wind energy often cluster around the equinoxes.  However, in general, there is some correlation between  the periods of peak wind energy and the demand for electricity which also peaks in winter.


Breaking the same dataset down by day shows that wind energy tends to be packaged in pulses a few days apart.


This pattern is present in many sets of observations.  This pattern of supply makes it necessary to have either an element of buffer storage in the system or an alternative that provides an adequate supply of  energy in during the periods of relatively low output.

Many areas have a pattern of diurnal variation, In coastal areas this can be caused by the different      heating/cooling behavior of land and sea with the direction and intensity changing with night and day.


These short term fluctuations emphasise the need for storage or alternative means of generation which can respond quickly to changes in supply and demand.

Solar

The principal variation in solar irradiance comes from Sun-Earth geometry.  The Earth's axis is inclined relative to its orbital plane, in the Northern hemisphere the pole is inclined towards the Sun in summer and away from it in winter and each day the Earth rotates about its own axis. As a result the solar irradiance varies during the day, and seasonal variations are related to latitude.

The graph below shows the estimated clear sky solar irradiance over the course of the day for Southern England (approx. latitude 51 deg. N) at four times of  the year.


In winter, the air mass at solar noon is approx. 4 and the length of day is only eight hours whilst in summer, the air mass at solar noon is close to 1 and the length of the day has extended to 16 hours. At the equator, the air mass at solar noon is always close to 1 and there is little variation in the length of day. Above the Arctic circle (approx. 66.5 deg. N) there are times when the Sun does not rise in winter nor set in Summer.

Superimposed on the variations imposed by planetary motion is the influence of  atmospheric conditions, the most significant of these is the effect of clouds.  Clouds are a feature of climate, itself closely related to latitude. The height and extent graphics below illustrate the variations.  These diagrams are compiled from the height and extent of the cloud cover at solar noon.

The first is for a maritime temperate climate, such as the South of England.


Clouds limit the solar radiation reaching the Earth's surface through a combination of absorption and reflectance.  In general, low, thick overcast cloud such as stratus can attenuate irradiance by more than 80%, whilst the effects of high level cloud such as cirrus may only cause 20% attenuation.  In southern England winters  are characterized by periods of low and very low overcast skies.  In summer the general pattern consists of few, scattered or broken  cumulus, the attenuating effect of these summer clouds is less than those of winter and the overall effect is to cause fluctuations in the output of solar devices.

 A significantly different climate to that of Southern England is that of Arizona, whose height and extent diagram is shown below.


The principal difference is the much lower frequency of occurrence of low level cloud and less seasonal variation.

The effects of planetary motion and cloud cover are combined in the simulation of solar irradiance over Southern England which is shown below:


This graph is based the solar radiation received by a horizontal surface, such as a field.  In most cases the yield of solar devices is increased by tilting them towards the Sun.  Output can be further enhanced by mounting the panels on a tracking device which ensures the panels are always pointing directly at the Sun, however the extra yield must be set against the cost of the  the tracking mechanism.

The graph below shows the effect of cloud on the output of a solar device.  It was compiled from three sets of observations taken around solar noon in June 2011 each with a different cloud extent.


The solar irradiance can vary significantly over a short period of time.  Under a clear sky, the fluctuation in the level of insolation is small and the output is a function of the Earth's rotation about its xis. Similarly, under an overcast sky, the output is more or less constant, but at a much lower level than under a clear sky, in this example, the output is reduced to approximately 10% of the clear sky value. In this case, the scattered cloud was cumulus drifting across the sky at around 4,000 feet obscuring the Sun during for intervals of varying length.. The level of attenuation lies broadly between the clear and overcast skies. The observations for scattered cloud show a phenomenon which might be termed cloud fringe effect, as the edge of the cloud passes over the device, there is an increase in the diffuse irradiation causing the overall level to exceed the clear sky value.

Description of Diagrams


The core of both sets of diagrams is a database of weather and related reports.

  • Cloudbase and Extent The diagrams are an attempt to show variation in the nature of cloud cover with climate. The diameter of the circle indicates the frequency of occurrence and those representing cloud cover are pie charts showing the proportion of the extent.   Extent is described using the descriptions  used in Metar reports, e.g.FEW (1 - 2 Octas), SCaTtered (3 - 4 Octas), BroKeN (5-7 Octas) and OVerCast (8 Octas).  Cloud is described as high, if the base is greater than 18,000 feet, low if less than 6,000 feed and very low if it is less than 1,000 feet. Only the highest, most significant layer is used in the computations. It is planned to evolve these diagrams to include more layers, the code was originally intended for use with Western Europe data where the lowest layer is frequently the most significant, however, they do not provide a full picture of the sky in monsoon areas  where the sky can be significantly more complex.
  • WindThe wind related graphs are based on SQL retrievals from a database of weather reports which were clipboarded into Excel.  Datasets where chosen which had an almost complete set of hourly observations   for a given year.  There are some anomalies in the process, but it is thought that the results give  are reasonable description of the variation in wind speed over time.

Friday, 6 September 2013

Pumped Water Storage

Pumped water systems store energy by increasing the potential energy of a mass of  water by pumping it from a lower reservoir to a higher one, then recovering that energy with a turbine when it flows back down again. The diagram below shows the  main components of a system which acts as a form of battery. During the "charge"  phase electric motors drive pumps which move water from the lower reservoir to the upper one. The energy is recovered when the water flows back to the lower reservoir and passes through turbines which drive "generators".  There are losses associated with the process, the figures quoted in Wikipedia suggest that typical efficiencies are in the range 65 - 85%.
The basic equation which describes the systems storage capacity is shown below.  The simplicity of the equation is in contrast to the construction of these of system which are often massive civil engineering projects.
The key term is the product of V and H.  For utility scale projects, the volume V is typically of the order of millions of cubic metres whilst the height, is tens or hundreds of metres.  The density of water rho is constant of at 1,000 kg/m3.  The acceleration due to gravity is also a constant at 9.81 m/s2 and the efficiency eta is a fraction less than one.  The efficiency of the Dinorwig plant in North Wales is thought to be around 75%. Q is the energy stored in Joules (1 kwh represents 3.6 MJ).

A typical urban water tower with a height of 30 metres and a storage volume of 1,000 m3 if used as a  pumped water storage system would have a capacity of approximately 50 kwh, assuming an efficiency of 60%.  However, major installations such as Dinorwig have sufficient capacity to provide some grid management capability by using electricity during off-peak periods to fill the upper reservoir and provide 1 to 3 GW of generating capacity during peak demand.

Pumped water is the principal grid scale storage technology.  The energy storage density is low, in the water tower example used above, the density is 20 tonnes/kwh. For small scale systems, the cost could exceed £1,000/kwh, these figures are high compared to lead/acid  batteries which might cost around £250/kwh for a similar sized system.  The main strength of pumped water is that very large quantities of energy that can be stored, much more than is possible with the various battery technologies.  Pumped storage systems are major civil engineering projects, some are based on disused quarries, others on large dams and disused mine workings are being considered for conversion. Existing systems have generating capacities similar to those of small to medium sized power stations, the buffer capacity for most grid systems is measured in hours rather
than days.

Links to other sources