Pages

Showing posts with label Solar.. Show all posts

Wednesday, 9 September 2015

Doris - A thought experiment in progress (7) - Climate

Doris is a computer simulation designed to explore the use of sustainable energy by a typical household, it has no physical reality.

The post which describes the background to the project, also contains links to related posts.
The core functionality of Doris is the facility to make estimates of the output of wind and solar generators using aviation weather reports (Metars).  It is written in Python 2.7 and accesses historic weather data stored in an SqLite3 database.  The code is modified explore a range of configurations and scenarios, in this case climate.

When I first started seeking out data on wind and solar resources, it became apparent that  it was difficult to make like-for-like comparisons, this was largely due to variations in climate and terrain.  It's easy to look for an explanation in maths and stats, but a quick look through the travel section of a newspaper will provide an answer.  Many North Europeans take their holidays in Spain because of the clear skies and sunshine and few South Europeans trek north to in mid winter because of the wind and cloudy skies.  For wind turbines terrain is important, the ideal location for a turbine is on a ridge which is at right angles to the prevailing wind, when they are placed in valleys and urban areas they may not perform well.  Also the distribution over a country can vary considerably, for example in the UK, the average wind speed in exposed western coastal areas is higher than sheltered ones in the east. When comparing the experience of different countries, the variations in climate should be taken into account.

The base case for Doris is a location in the south of England (Koppen climate type: Cfb) with 1 kw each of wind and solar generating capacity.  The post "You have to do both" contains some discussion of a wind/solar based system might behave in this climate.

For this post, I've deliberately chosen some extreme and contrasting climates.  In the context of Doris, variations in climate come from the location which is used to provide estimates of clear sky solar irradiance, a crude model which provides some allowance for variations in cloud cover and weather reports from a local airfield.

The first graphic comes from a run where the base configuration was run with data from hot desert region (Koppen climate type: Bwh).  In this case, solar makes the greatest contribution to meeting the load, but at 35 deg. North of the equator, there is enough season variation to draw in supplies from the grid, the average wind speed in this place was low, so the yield from wind was low.

Based on the results from the base configuration, a possible adaption was to remove the wind generating component and double the solar capacity, the effect was to significantly reduce the draw down form conventionally generated sources.

At the other extreme is a northern continental area (Koppen climate type: Dfc) at a latitude of approximately 65 deg.  There is significant variation in the yield from solar over the year, this drops to zero in December and January, but provides a useful contribution in summer.  This arbitrarily selected location is not very windy and the contribution from wind even in winter is low resulting in a large draw down form the grid.

A logical adaption was to triple the wind generating capacity and halve the solar element, this still did not make a major reduction in grid draw down.

Since I have been studying sustainable energy sources, there is a recurring issue which might be termed the "winter problem".  In the northern hemisphere the demand for electricity peaks in the winter months whilst the supply can be low due to low solar radiance and periods of calm.  

Thursday, 10 July 2014

But clouds got in my way

I'm old enough to remember when software came with manuals bound up in ring binders which allowed pages to be replaced as errors were found, bugs removed and features inserted.  Not a few of these volumes had chapters prefaced with a quote from "Alice in Wonderland" often without any context.  Having contributed to software documentation I will confess seeking out displacement activities such as the hourly mug of coffee, routine admin chores and listening to the radio, maybe I should have delved into poetry and and attempted to engage my reader (assuming that there ever was one).  Another useless fact, all modems in the 1970's were called Gandalf.

Over the past few months, I've been up working my way through a diverse collection of routines and attempting to package them up into commented Python modules.   The comments include a description of the functionality and a reference which points to source of an algorithm.  This usually takes longer than writing the code, but less time than rewriting it when the re-use event fires.  I'm also contemplating adding some poetic quotes to the comments.

I was revisiting the code which produces these cloud height and extent diagrams (which is written in VB.Net) when I heard the radio playing Joni Mitchell's "Both Sides Now" and thinking these graphics were a poor substitute for "Rows and flows of angel hair, And ice cream castles in the air, And feather canyons everywhere...."

Clouds have a significant effect on the output of solar devices.  At the time of writing during the afternoon of an overcast July day, I guess the solar irradiance is around 250 watts/m2, two weeks ago when the sky was almost clear of cloud, it was closer to 850 watts/m2 or in human terms frowns and smiles.   The ideal place to put a solar device, but possibly not to live if you like sea breezes, is a hot dry desert, the clear sky irradiance is high and the number of clouds few.  This is illustrated in the diagram below:


Each circle is a pie chart showing the extent of the cloud cover over a given month for a given height interval.  The dark slices denote an overcast sky and the light ones that there are just a few clouds.  Visually this means the darker the pie, the more clouds in the sky.  The yellow pies show the proportion of clear sky.  This example is for a desert location with lots of clear sky, when clouds do appear most of them are high in the sky and in general, high level cloud causes less attenuation of solar irradiance than low level ones.

Compare this with a plot for a temperate maritime climate, the most striking difference is that most of the cloud is low level, in the south of England this frequently overcast stratus in winter and few and scattered cumulus in summer (except to day which is just dull).  The intervals of clear sky are much shorter than in the desert and there just a lot more clouds.


These diagrams do not take into account the seasonal variations in solar irradiance due to Sun-Earth geometry which cause the irradiance to be significantly lower in winter than summer.

The source data for these plots is Metar reports which are designed to facilitate the safe operation of aircraft, but can also be applied to solar energy.  The plot is based on the highest reported layer of cloud.

At the risk of going off an a tangent, most of this blog was written using a Raspberry Pi.  This was acquired for an energy management project, but is proving to be an effective alternative to my laptop.  I have not done any serious energy analysis, but it is quiet (no cooling fan) and nothing is warm to the touch, so there is little heat dissipation.  About twenty years ago when I first started writing software in this room, the four computers where the heating system, now I have to light a fire in winter to keep warm.

Friday, 17 January 2014

Diffuse Solar Iradiance

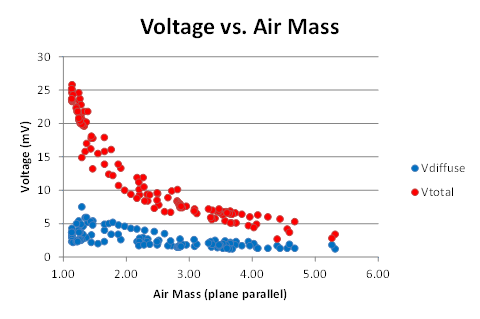
There are several models which can provide a good estimate of the solar radiation received by a surface, one of the simplest is the Meinel model which relates direct beam radiation to air mass.  This formula is based on observations made in the Mojave Desert in the 1960's.  Whilst it does not take into account atmospheric conditions such as water vapour and aerosols (minute particles resulting from many human and natural processes) for which data is not always readily available, it provides a reasonable estimate of direct bean, clear sky solar radiation.  The diffuse radiation is often estimated as a fraction of the direct beam radiation, often a figure between 10 and 15% is quoted.  However, it became clear when looking at data from a variety of sources, that the diffuse fraction increases as air mass increases.  Clear sky diffuse irradiance is inversely proportional to air mass in the same way that direct beam irradiance is, but the rate of decline is slower, hence the increase in diffuse fraction.


 This project is an attempt to produce a simple model for diffuse irradiance in southern England.

Comment

This is work in progress and has not be reviewed and should be treated with caution, It is an update on earlier one entitled "Then Diffuse Fraction" which has been deleted.

The Equipment


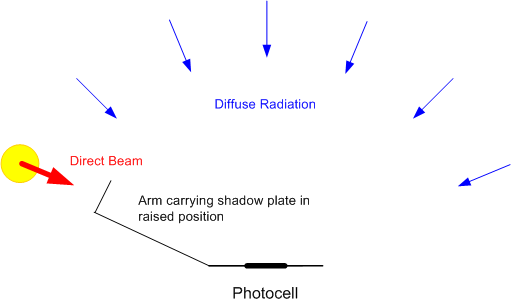
The equipment consists of a flat photocell mounted on a horizontal surface.  This photocell has good cosine response.  The short circuit current of the photocell is directly proportional to the irradiance, in this case the short circuit is provided by a 10 watt 1 ohm resistor, the voltage across indicates the current through the cell.  An arm mounted in front of the cell carries a shadow plate.  When this arm is raised, the photocell is in shadow and only receives diffuse radiation, when it is lowered, the photocell receives both diffuse and direct radiation.  The concept is shown in the diagram below:


The device is constructed from Meccano and plywood.  Three screws provide a means of obtaining a horizontal surface as indicated by a level gauge.The photo shows equipment in use.


Originally, the equipment was meant to be a prototype for something better, however, as data has accumulated, I am reluctant to make changes and introduce inconsistencies into the data.  One useful enhancement would be to put an amplifier into the circuit to increase the precision of the measurements which is currently limited by capabilities of the multimeter.

Observations

Data is collected on days when a large part of the sky is clear, such days are rare in the south of England and accumulating a workable dataset is proving to be a slow process.  Ideally, the analysis should be based on a full year's data, at the time of writing, there is only eight months from May 2013 to December 2013.

Observations have been made in a number of locations.  For air mass values in the range 1.5 to 4.0 (mid morning to mid afternoon), the data appears to be similar for any open space, such as a public park ringed with trees.  For higher values of air mass (around dawn and dusk), it is preferable to cycle to a south facing beach.

Dogs

One of the hazards of collecting data in public places is the attention of dogs, I like dogs, so this is not a problem, but it has resulted in some curious observations, for example, a freshly laundered poodle has a much greater effect on diffuse irradiance than a mud splattered labrador.  This is thought to have no scientific interest.

General Comments


An important part of the data collection process is the notes taken at the time, these provided an explanation for some of the variance.

  • Haze.  This was present on several summer days, the effect was to increase the diffuse irradiance to over 200 watts/m2.
  • Low Level Cloud. If cumulus is forming or present in the sky, the diffuse irradiance will rise above the clear sky level.  The presence of low level cloud implies that the relative humidity in the lower part of the atmosphere is close to 100%.  In an otherwise clear sky, small fragments of cumulus can form and disperse very quickly.  It seems that the formation of a cloud is preceded by an increase in diffuse irradiance.
  • High Level Cloud. Except when the high level cloud is between the sun and the photocell, high level cloud causes little or no increase in the diffuse irradiance.
  • Jet Trails. Occasionally, the total irradiance would dip as an airliner came between the Sun and the photocell.  One morning, a larger than average jet trail appeared, this was probably created by an Airbus A380 bound for one of the Paris airports.
  • Morning/Afternoon Variations.  It is common for there to be significant differences in the irradiance before and after solar noon.  In the south of England it is common for the sky to be clear during the first half of the morning after which clouds start to form, as a result, the irradiance is higher in the morning than the afternoon.  In other climates, irradiance can be at a maximum in the early afternoon.
  • Seasonal Variations.  Two factors which influence solar irradiance are the water content of the atmosphere and aerosols and these vary according to the season and climate.  In southern England the water content is higher in late summer and early autumn than in the winter months.
Calculations

In the South of England, the "economic" range of air mass is approximately 1.5 to 6.0.  In this range the plane parallel method of calculating air mass provides a reasonable approximation and some computational convenience.  The calculation (with the exception of the equation of time) is described on this page:

Sun-Earth Geometry

Results so far.

The first graph shows the voltages plotted against the plane parallel air mass:
Extracting the diffuse measurements and breaking them down by the state of the sky gives this graph:


The data for hazy days and those when there were a few cumulus in the sky are distinct from those when the sky was almost free from cloud or contained a few or scattered high level cloud such as cirrus.


First Attempt at a Model

Experience with this photocell suggests that its sensitivity is approximately 40 mA per watt/m2 as the resistor is 1 ohm, this becomes 40 mV per watt/m2.  Discarding the haze and cumulus and amalgamating the clear and cirrus set and expressing the results as watts/m2 gives:


This is a reasonably tidy dataset, however data is not evenly distributed across the range of air mass, however, a simplistic curve fit using the same form of equation as the Meinell model has been attempted.  It is probable that as more data is collected, the values of the constants will change.


At the time of writing, only limited testing has been done using this diffuse irradiance model.  It appears that when combined with the Meinell model it produces better estimates of global horizontal irradiance than simply making the diffuse element a fixed fraction of the direct beam component.  The graph below shows an estimate of the global horizontal irradiance for a clear, June day on the South cost of England, this appares to be reasonable when compared to the output of a personal weather station.

A more systematic evaluation will take place when a full year's data is available.

Correlations

For most locations, not much is known about the state of the sky at any given time.  The nature of the irradiance can be source of information about the atmosphere.  Initial attempts to correlate the data with  derivatives of temperature and dew point data from the surface weather reports from the nearest airfield (approx. 7 km to the west) have not been successful.  An initial attempt has been made to use data from NASA Aqua satellite obtained from the NASA Earth Observations website and this suggests an interesting line of enquiry.


If the data is broken down into three bands defined by aerosol optical depth, there is a suggestion that the data will segment:

Some of the highest values of V diffuse were observed when haze was clearly visible and  haze is associated with high values of AOD, similarly, the lowest values were obtained when the AOD was also low.  This is to be expected because AOD is one the inputs to parametric models of solar irradiance and it is also used as indicated of air quality.


A similar exercise with water vapour as less conclusive.

Variations on this theme using parameters based on surface temperature and dew point produced similar results.

Future Work

There are three tasks:

  • Continue collecting data when the opportunity arises until at least until April 2014 to obtain a dataset extending over a full year.
  • Determine if the same process can be extended to create a location specific model for direct normal irradiance.  This can be calculated from measurements of global and diffuse horizontal irradiance, however, the equipment in its present form may not be able to provide data of adequate quality without modification.
  • Attempt a model which accounts for seasonal variation.
Acknowledgement and Appreciation

Data relating to Aerosol Optical Depth and Water Vapour was obtained from the NASA Earth Observations website. The data available on that site is highly instructive and I would like to express my appreciation to NASA and NOAA for making it available. 


Friday, 3 January 2014

Starting over

Not too far from where I live is a house that was built sometime in the 1980s, I guess it was none too comfortable to live in.  Whilst it was being partially demolished, I did not see any signs of insulation, just a lot of windows with rotting frames and a load of rusting radiators.  Technically, it is being extended, but in reality, it is being rebuilt.  The roof is well insulated, the walls have a 100 mm layer of polystyrene and the windows are double glazed.  Not wanting to be a nosey neighbour, I have not enquired about the heating system, however, I know that a wood burning stove was installed in a similar development and has yet to be lit.  Retrofitting a property to that standard would be difficult and expensive and unlikely to pay-back.  That statement is based on a study of my own home where you could spend a lot of money, not be much warmer and would lose the character of an airy Edwardian semi.

Sustainability is much easier to attain with a clean start.  I am currently working on (more accurately "staring at") an electrical storage project.  Storage is one of the key components in a sustainable energy economy, but batteries are DC devices and my home is wired for AC.  AC is a logical choice for distributing electricity, but increasingly it is consumed at DC.  Some time back I did a quick survey on how we use electricity in our home and produced this graph, this suggested that only 15% of electricity has to be consumed at 240 volts/AC or in other words the washing machine and vacuum cleaner.  Some things like the fridge are available in low voltage DC forms, computing and entertainment devices all have power supplies to shift from high voltage AC to low voltage DC.  We are slowly migrating the lighting from CFL to LED devices.  Each LED light bulb has its own power supply circuit for AC to DC conversion.

Even though most things use low voltage DC, distribution within the house is 240 volts AC,  That was a logical way of doing things in the 1920s when electricity was first installed and all appliances used AC, the better part of a century later, there may be some value in examining household distribution. 

If storage were to be part of the household energy system without any radical changes in wiring, the first step would be go from 240 volts AC to 12 or 24 volts DC for battery charging, the battery would be connected to an inverter to get back to 240 volts AC to go through the ring mains, devices connected to these would then drop it back to low voltage DC.  This would be a complex and inefficient system and one which is not going to get built any time soon.  The small DC storage project is all DC, albeit with some level shifting, and is relatively simple.

I stumbled over another example of the complexity of legacy systems.  When the railways moved from steam engines to electric motors, high voltage DC was chosen because at the time only DC motors could provide the high starting torque needed to get a train moving.  Modern electric trains (so I am told) use AC motors.  Thus the grid feeds trackside substations with AC, this is converted to DC for the trackside rails, the train then converts it back to AC.  I doubt if the losses in this system are great, but the result is a complex system with DC for traction and 3 phase AC for everything else.

In the UK there is a debate over how to curb emissions which can be grossly oversimplified to nuclear versus the renewable technologies such as wind and solar.  My own view is that there should be different paths for "old" systems and "new" developments.  For the legacy systems which are based on large amounts of uninterrupted energy from fossil/nuclear sources, the key technologies are conservation and energy management.  It is valid to determine if it is possible, practical and economic to build new systems which are more or less dependent on renewable resources which are discontinuous (the Sun does not shine at night and the wind does not always blow), these would incorporate appropriate technologies, e.g. LED lighting and storage.  It's so much easier to design these things from scratch and not have to mess with the past.


Friday, 6 December 2013

Wind is Moving Gas

A recent review of an electric car could be summarized as "This vehicle is not petrol driven".  Like a lot of things energy related, electric vehicles are not a simple swap from an old technology to a new one.  I have never owned or driven an electric vehicle so this is a framework which I might use to evaluate one, a sort of automotive lit-crit.


Most reviews of electric vehicles focus on range anxiety, at a guess this is more do with opportunities to re-charge than the distance/charge, typical numbers seem to be in the 100 - 200 km range.  I live in an area of controlled parking which is next to a railway station.  A statistically invalid survey of the parking permits of the vehicles in our road, suggests that 40% have travelled less than 1 km and that the remaining 60% have travelled less than 5 km and are parked in a garage or driveway at night.  The record shortest journey is 150 metres.  Whilst many of these vehicles are capable of crossing continents, most don't.  Whilst I have not lived in the US, I have spent a lot of time working there driving the American Dream (a.k.a. a Dodge Neon), even with a full schedule it was rare to travel more than 150 km in a day.  so with the significant exception of family holidays and trips to granny, range for many people is not an issue.

Cost is harder to deal with.  Half an hour of Googling and doing things with a pencil resulted in the following conclusions, first that electric cars are expensive to buy and secondly if charged up on-off peak electricity, cheaper to run.  What that does for my wife's 40 km commute is not obvious.

A neighbour recently described me as an "eco" because I rarely drive and prefer my bike, but I'm male and therefore lust after low slung sports cars (although my car-boot bike maybe quicker around town, sadly, beyond the city limits its not a contest).  I might drool over a Tesla.

I dispute the claims that electric vehicles produce zero emissions.  In the UK electricity is produced from a variety of sources including coal, gas, nuclear, wind and solar, last time I looked, CO2 emissions were around 0.4 to 0.5 kg/kwh for the country as a whole.  The environmental issues are at the point of generation not the car.  The fuel for electric vehicles is coal, gas, nuclear, wind and solar rather than petrol.

In the context of a sustainable energy economy, electric vehicles offer personal transportation using renewable sources such as wind and solar.  Equally important is that they are mobile storage devices.  A typical car spends 5% of its time on the road and 95% waiting to go somewhere.  Wind and solar sources produce energy at the whim of the weather and fossil/nuclear sources are most efficient at a constant load, this is why off-peak electricity maybe half the standard price.  The storage capacity of electric vehicles could be used to improve energy management as a peripatetic part of a smart grid.

At present, the case for electric vehicles is not proven, a situation made more complex by the availability of subsidies.  Subsidies are a good economic tool to bring about change, but they can also be proof of the doctrine of unforeseen consequences.

A not to close look at the electric vehicles on offer suggests that they "not petrol driven".  As electric vehicles are a new technology, maybe the starting point should be elsewhere.  A few times when I have been meandering through the countryside I have been overtaken by a golf buggy.  These vehicles cost around £4,000 (I think) and have been adapted for use on the Moon, so making them fit for the daily commute should not be too great a challenge.  A vehicle costing £5,000 with low running costs and a range of 200 km would be the car most people need, but maybe, not the car they want.  However, make a low slung version with good curves and you have a Sinclair C5 - Who said they were a bad idea?

Safety on the roads is an issue and the ability to survive a collision is important, once you have been in accident, this is not an academic concern.  Much as I love my bike, I am acutely aware of it's vulnerability and I nag my children to wear cycle helmets.  The city I live in is flirting with 20 mph speed limits, does a 20 mph environment offer the potential for lighter vehicles?

Postscript

After I finished this post, I saw an innovative electric trike, driven by a combination pedals and an electric motor fuelled by four lead acid batteries and a Mars bar.  I gave chase, but quickly lost contact before I could ask the owner's permission to take a photo.


Sunday, 1 September 2013

Laundry

One of the side effects of installing rooftop PV is a desire to balance generation and consumption. I know of one father who is frustrated by his daughter's use of hair straighteners.  A recent piece in "The Guardian" told of a couple who were surprised by the amount of energy used by a tumble dryer.  Proof of the doctrine of unexpected consequences is that working from home results in swapping the daily commute for domestic chores.  In an attempt to turn laundry into environmental science, I sometimes weigh the washing before hanging it out to dry and then once again when it is it back in the house.  The results of a year's bizarre behaviour are shown in the graph below:


Over the year, the average water removal is 1.5 kg/wash.  By making some assumptions about the efficiency of tumble driers, this approximates to the equivalent of 600 kwh/year, which might account for say 10 - 20% of the average household electricity consumption of 3,500 kwh/year.

Several houses in our road put their underwear on public display a couple of times each week. but there was a time when most households had a washing line and a prop to keep sheets of the ground.  To authenticate this statement, consult the works Shirley Hughes, a favourite author of bedtime stories for many children.

In the newspaper supplements which attempt to promote "eco" living, you will find adverts for rooftop solar water heaters (useful for six to eight months each year) costing around £3,000, ground source heat pumps for even larger amounts, but with the lure of RHI payments.  Washing lines and whirligigs seldom figure in these publications.  We are fortunate in having a conveniently placed railing, but if we installed a proper south facing washing line, the cost might be £100 for poles and concrete foundations, this would be an investment which would pay back in a couple of years.  Laundry is not a sexy subject, even for environmental journalists, so can the lifestyle gurus make laundry fashionable, reduce emissions and boost energy security?

Conservation is difficult for politicians, our present government has attempted to be "the greenest government ever", but it is easier to encourage wind turbines than washing lines.  Does 10 Downing Street have a whirligig?


Friday, 7 June 2013

The Sun does not shine at night

Wind and solar energy systems are often described as "renewables" in contrast to fossil fuels which are not renewable unless you live in geological time.  An alternative description would be climate and location dependent energy systems.  Location defines the terrain over which the wind for a turbine flows and it defines the Sun-Earth geometry for a solar device.  Climate describes the seasonal variation in wind and the clouds which pass between the Sun and the Earth's surface.  One of the distinctions between wind and solar systems and fossil/nuclear ones is that the weather determines the output, not a person sitting at a control panel.  Both wind and solar are subject to significant diurnal and seasonal variation and the sun does not shine at night.

The graph below is a simple simulation of solar irradiance that might be experienced by my back yard in southern England.  The extremes are high air mass at solar noon and the the prevalence of stratus during the winter months.  In summer, the air mass gets close to one at noon and whilst clear skies are not unknown, cumulus is a frequent sight from my workroom window.  It is not uncommon at any time of the year to be unable to get a usable amount of energy out of a small solar panel for a period of several days.


Wind has similar seasonal variations, often peaking around the equinoxes (graph did not get finished in time for this post!).

 There are also significant fluctuations during the day and even within the space of an hour as shown by the graphs below..

Whilst there are a variety of storage technologies which can buffer short term variations, seasonality is a challenge for renewables and for an off-grid project it may be necessary to have excess capacity  to make make the most of calm or dull months.

Storage is the missing link in the evolution of a sustainable energy economy.  There has been a significant change in emphasis over the past 30 years.  I recently acquired a copy of  "Small Scale Wind Power" by Dermot McGuigan which was published in 1978.  This work contains a discussion and descriptions of battery based storage for off-grid systems.  Fast forward to the 2013 and wind and solar devices have proliferated but as grid-tied systems,  diurnal and seasonal variations are absorbed by the the fossil/nuclear grid.  The popularity of grid-tied system has been enhanced by incentives such as feed-in tariffs.

My own view is that the base load of Western European and North American energy economics will have to be met from fossil/nuclear sources, few people want transport, hospitals, schools to function at the whim of the weather.  However, in some situations, off-grid systems are attractive, not least of which is that they don't increase the demand for fossil/nuclear energy, but more subtly because they provide a challenge to work within an energy budget.  Historically our energy economies have evolved on the basis of readily available cheap energy, starting a project with the constraint of having only wind, solar or other renewable energy technology, leads to some different solutions.  Whilst I have an open mind on feed-in tariffs, I would like to see some similar incentives for achieving true energy sustainability.  This does not exclude using the existing grid to move energy around, for example from an offshore wind farm to an office complex.

The batteries which are emerging for use in automotive applications such as hybrid and electric vehicles may have something to offer homes and offices. I have not studies these in much detail, but a brief look suggests that 10 kwh of storage has a similar or lower cost than a rooftop PV system.  Integrating this amount of storage into a home or office significantly changes its energy economy, if the building is fitted with solar panels, then energy harvested during the day can be used for lighting at night.  It also allows a closer integration with wind farms and might also improve the efficiency of coal and gas power stations by smoothing out demand.  In the UK the demand for electricity peaks in the early evening and is at minimum overnight.

Readers with an interest in maths might enjoy this:

http://www.brighton-webs.co.uk/montecarlo/simulation.htm

It describes a simple simulation of a small energy system.


Wednesday, 29 May 2013

An Overcast Sky from Above

The picture was taken just before sunrise on an early morning flight from London to Glasgow in October 2011.


Weather reports suggest that this was a layer of stratus a few thousand feet thick.  From the ground this would have been a grey, overcast sky, possibly with some drizzle.

Stratus is a feature of the sky over England during the winter months, the diagram below shows how the nature of cloud changes during the year.


In winter, low, broken or overcast skies which are full of stratus are common, in summer these give way to scattered and broken cumulus.

The effect of a thick overcast sky on solar devices on the ground include:
  • Significant attenuation of solar radiation caused by a combination of reflection and absorption, often this is less than 20% of the level that would be expected from a clear, dry sky for the same value of air mass.
  • There is no direct sunlight (i.e. no shadows) and all the radiation is diffuse.
  • Often the density of the radiation is equal from across the sky.  Some experiments suggest that the yield of PV panels might be higher under an overcast sky if mounted horizontally, rather than sloping to face the sun.
These effects are exaggerated because thick overcast skies occur in winter when the Sun is low in the sky (air mass around 4.0 at solar noon).