Pages

Showing posts with label economics. Show all posts

Sunday, 7 January 2018

The early days of electricity - Diverse decsions and technologies

Public electricity supplies started to evolve in the UK during the 1880s.  Today electricity is a utility accessible by a high proportion of the population, but in its early days it was part of the luxury goods industry, a unit might cost between 4d and 1s 3d (2p to 6p) which is around £1 in today's money.  Its attraction was that it was convenient and clean and therefore perceived as being healthier than the gas lamps that it was to displace over the next half century.  Arc lamps improved the lighting of streets and public spaces and this gave local authorities an interest in the industry.  The industry grew using both public and private capital, and some local authorities proved to be adept in managing the evolution of a new technology.  Street lighting was often managed by the gas committee, because that was how the streets were lit, so decisions about borrowing substantial sums against the rates were being made by men who were often involved in decisions about the lighting of urinals

The caption on this cartoon was Electricity for the Ballroom
Electricity works, especially those supplying DC had to be close to the consumer because of the limitation of the early distribution systems.  This resulted in generating plant being located in unlikely places like London's Carnaby Street: its contribution to the swinging sixties is well remembered but its power station is long forgotten. The search for early power stations often takes one to the posher parts of town.

Most of the early dynamos and alternators were turned by reciprocating steam engines.  The early engines were relatively small and built by companies also known for their traction engines and road rollers such as Robey or Fowler.  Until the development of high speed engines such as those of Willans which facilitated direct coupling, the generators were connected to the engine by a belt drive.  Belts would sometime break, in 1882,  the Mansion House was provided with electricity from a generator installed in the basement, where the belt was driven by a gas engine.  During a dinner the belt broke giving the diners the impression they were being attacked by gunfire.  In 1888, the first turbine driven alternator was installed at the Forth Bank power station, close to the centre of Newcastle.

Large generators were steam driven because steam engines could be built to supply hundreds of horsepower and it was a mature technology. At this time steam engines were almost as common as electric motors are today, they powered mills, railways, ships, sawmills, pumps and anything big which needed turning.  Smaller plant in urban areas often used gas engines.  By 1880, most urban and some rural areas had a gas supply and whilst this was mainly used for lighting, it could also used as fuel for engines such as those made by Crossley.  The attraction of gas engines was that there was no need for a boiler and most could be hand cranked into life when needed.  Judging by the number of adverts for fractional horsepower gas engines in pre-1900 magazines, many modest homes may have generated their own electricity from gas.  Such a system is described in a biography of Magnus Volk, the house in which it was installed is comfortable, but not grand.  Many micro systems incorporated a bank of lead acid accumulators making it unnecessary to run the gas engine continuously.

During 1880s and 90s AC and DC systems competed for supremacy.  The AC system would eventually win because it facilitated transmission over long distances allowing big power stations to be sited away from city centres.  However, DC did have the advantage of being able to use lead acid accumulators for storage.  Then as now, the demand for electricity peaked in the early morning and early evening and if only a few hundred homes were being supplied overnight demand could be met from the accumulators allowing the steam plant to be shut down or the boilers banked up.  Accumulators also provided some back-up in the event of plant problems, for this reason, some consumers perceived DC systems as being more reliable.

In the early days, the demand for electricity was measured in kW rather than MW making it possible to supply rural communities using small plant connected to consumers by wires hung from wooden poles. Some of these used water power, Godalming claims the distinction of having the first public electricity supply, this was from a generator turned by a water wheel in a mill. Reeth in Yorkshire had a similar arrangement.

Initially, electricity was an urban industry relying on clusters of high income households, some smaller communities were still not connected to a central generating station until well into the interwar period.  It was during this time that many small electric companies were formed, examples include the Steyning Electric Light Company and the Peacehaven Electric Light and Power company.  I've seen photo's of these companies' plant, both show belt driven generators, in both cases it looks like the motive power is coming from an industrial internal combustion engine, but it is not clear if the fuel was oil or gas.  One of the more interesting of these companies is the High Salvington Electric Light Company, this served a small development of houses on the Downs to the north of Worthing. The generator was turned by a wind mill/turbine similar in design to those of West Texas -the electricity was used to charge up accumulators which in turn supplied the consumers.  There was an oil engine back-up for days when the wind did not blow.  Now that utility scale storage, like Tesla's installation in Adelaide is becoming available, High Salvington can claim to be pioneer in the field of sustainable energy.


Sunday, 1 October 2017

A random history of energy economics (3) - The life cycle of fuels

Fuels like any other product have life cycles.  The stages of the classic life cycle are growth, maturity and decline.  For some fuels like wood, the length of the cycle is measured in millennia, that of coal looks like it might be centuries and carbide probably decades.

My understanding of acetylene lamps is that they were developed for cars and motorbikes at the very end of the 19th century.  Whilst electric incandescent lamps could be powered by a lead-acid accumulator, they were not bright enough to allow safe driving at speed.  The attraction of acetylene is that it burns at a high temperature and produces a bright light.  The gas was generated by the action of water on calcium carbide, the lamps were so constructed that a reservoir of water dripped on calcium carbide which was then burnt in a lamp with a reflector.  The brightness of the lamp was controlled by adjusting the water flow, as the gas was generated, the carbide turned to slaked lime.  "Carbide" was sold in garages along with petrol and oil during the 1920's, but as automotive electrics improved and effective headlamps which could be controlled by a switch became a standard fitting, carbide lamps were largely displaced by the 1930s.

Kerosene (a.k.a. paraffin) as a domestic fuel had a somewhat longer life cycle, it was used for lighting and cooking in late 19th century.  In the era of solid fuel ranges. it facilitated cooking without first having to light a coal fire, although many found the smell unattractive.  Paraffin heaters were widely used well into 1970s and may people remember the Esso's adaption of "the smoke gets in your eyes" for their TV adverts.  Paraffin heaters were generally displaced by low cost gas central heating in the 1970s.

The same pattern of growth, maturity and decline is apparent in the UK coal consumption.  A spokesman for OPEC once commented that the UK did not run out of coal, they just stopped using it.  In the latter part of the 19th century consumption grew as industry, the railways, gas production and other applications expanded.  It remained constant for approximately half a century until the 1970's.  During this time the economy was growing, but technology was evolving which allowed coal to be used more efficiently.  In 1890, electrical power generation had a thermal efficiency well below 5%, by 1970, this was approaching 40%.  The boilers used in the early power stations operated around 150 psi, by 1945 some were operating at 675 psi, the rising temperatures and pressures resultined in higher operating efficiencies.

In the 1960, natural gas (mostly methane) from the North Started to displace coal as a domestic and industrial fuel.


The displacement of coal by natural gas is apparent in the graph below.  Starting around 1830, many towns acquired as gas works either privately or municipally owned, in the early years the principal use was for lighting, but cooking, heating and industrial use increased.  Between 1900 and 1930, electricity, also generated from coal, displaced gas for lighting.    The availability of North Sea gas bought about the extinction of the coal gas works in less than a decade.


Gas turbine power stations, steadily displace coal fired steam technology, a process which accelerated in the 21st century as concerns over the environmental effects of coal grew.

Relevance for Today

The energy mix is constantly changing, the driving force is technology, over two centuries it has included coal, wind, nuclear (after 50 years is this an old technology) and many evolutions within each one.  There is a lot of evolving technology, offshore wind and electrical storage maybe the key elements.  Several cities are talking about petrol or diesel vehicles and only allowing electrical ones, so more change can be expected.


Tuesday, 26 September 2017

A Random history of energy economics (2) - The Horse and the Lorry

By 1900 railways were the most important element in Britain's transport infrastructure, but they only provided town-to-town communication.  The distribution of goods within a town was done with men with barrows and horses with carts.  In the rural areas "carriers" moved goods and people around with horse drawn wagons.  Horses were widely used well into the 1930s by which time motor transport was firmly established.

I came across some figures comparing the cost of coal distribution from depot to customer by 30 cwt truck and a horse and cart in 1931.  The figures seem to relate to an adequately funded and well run coal business.  Two points about the graphs, first they are for 1931 and are not comparable to costs in 2017 and that the original data is in pounds, shillings and pence which was converted decimal pounds for the benefit of Excel.  I have doctored the data a little for the sake of comparability.  In 1931, the price of domestic coal was between £1.50 and £4.50 per ton depending on the grade, local terrain and market conditions.  Anthracite was the premium product whist Bituminous coal was cheaper, also coke from gas works was widely used.


Both the horse and truck were depreciated over four years and  funded by money at 5%, the horse cost £90 and the truck £250.  The cost structures for both modes of transport is broadly similar, the exceptions are higher capital related costs of the truck, the legal requirements for a license and insurance and maintenance.  Food for the horse and fuel for the truck are similar as are the wages of the driver.

The big difference is the level of productivity, the horse shifts 38.5 tons/week, whilst the truck can do 49.5, but the unit costs are similar at around £0.20/ton.  I suspect that there was a lot of variation within the industry.  If only one man was employed to work with the truck, he would have to work harder than the bloke with the horse and cart, the references I have seen to coal sacks at this time suggest there were 1.25 cwt ( very roughly 62kg or very heavy, I struggle with 25kg bags of sand).  This might have been OK for a youngish man shooting coal into a cellar with street access, much less for an older one shifting the bag from the street to coal store in the scullery at the back of the house.


Some random reading suggests that the domestic coal market was split into three sectors.  At the top end would be customers that bought coal in large quantities, say greater than half a ton, possibly belonging to a "coal club"  which spread the cost more or less evenly over the year, trucks would give an advantage to merchants serving this group.  Those serving customers purchasing less than half a ton and paying the current market price might have a cost advantage from the potentially lower costs of the horse and cart.  At the bottom end of the market would be those purchasing small quantities of coal, possibly as little as 7 pounds would pay high prices to men with barrows.


Thursday, 21 September 2017

A Random History of Energy Economics (1) - Gas Engines in the Home

Over the past year I've been acquiring a few copies of the "The Model Engineer and Amateur Electrician" at car boot sales.  I now have about 15 examples dating from 1899 to 1919.  Models make up a large part of the content, but there is also an informed debate on technology as it was evolving.  At the bottom of one page is a note that a Frenchman has observed that a platinum wire is heated with an electric current and then placed in a jar of methane continued glow.  I'm guessing that this curiosity was an early version of the catalytic converter found on most modern cars.  There are notes on telephones and wireless telegraphy and a discussion of the ideal way of storing energy to power motor vehicles, electricity is was thought to have potential and compressed air to be a bad idea.  Electric shock treatment must have been fashionable as some advertisers claimed it was better to be shocked by their apparatus than that of a rival company.  With hindsight X-Rays were not something the citizen scientist should be encouraged to mess with.  The classified ads can be intriguing, there is a suggestion that a vicar had a model gunboat to sell and why would someone expect to exchange an accordion for a lathe?

In the diversity of items advertised, three occur frequently, these are gas engines, dynamos and accumulators.


In 1905, electricity was still a luxury product costing may be 4d - 6d per kwh (roughly 50p in today's money) and many urban areas did not have a supplier and remote households had to generate their own electricity if they wanted it.  Gas, however was a mature technology, many gas companies had been established between 1820 and 1850 and most urban areas had a gas works.   In some coastal towns, the coal was supplied by brigs from Newcastle running themselves aground on the beach  and being re-floated after their cargo had been hauled away by horse and cart. The cost of gas might be something like 2s 6d and 3s per 1,000 cubic feet, depending on the nature of the gas this would be roughly 10p/kwh today.

At the turn of the century gas was increasingly being used for heating and cooking, but the principal application was lighting. Whilst gas lighting was better than candles, it could make the air in a room foul, the products of combustion being carbon dioxide, carbon monoxide and water vaoiur plus anything else the gas company could not get rid of.  Gas mantles required cleaning  and lighting, whilst electric lamps were clean and available at the flick of a switch.  Doctors wrote letters extolling the benefit to health of electric lighting.  It's not easy to make a like for like comparison with the cost of gas and electric lighting but it seems that electricity was perceived as being 5 - 10 times more expensive.


Fractional horsepower gas engine/dynamo sets provided a source of electricity where a public supply was not available and possibly a means of getting a supply at a lower cost.  At the time of writing, I'm still attempting to identify a property which had such an installation.  At a guess, a common configuration would be to have the machinery in a shed where it was used to charge accumulators which were in turn connected to the lighting circuits in the main house.  Voltages seem to have been in the range 4 - 12 volts and accumulators could be relative large, say more than 50 AH.

After 1900, the public electricity supply expanded rapidly, but in most places this was AC, whilst the use of DC in the home decreased, cars and motorbikes created a new demand and low voltage dynamos were used to charge automotive batteries.  Early radio sets also needed a DC supply.

The magazine has several references to water engines, for owners of landscapes which were suitable for the construction of small dams and there a few mentions of "hot air" engines, I take this to mean "Stirling" engines, but so far no description of the workings of these devices.


Saturday, 4 March 2017

Wind power close to the city centre

When I first worked on this image of historic windmill sites around Brighton I was more interested in the terrain:.


Most mills are located on ridges or close to the coast to take advantage of the smooth air flow coming off the sea to the southwest.  Equally interesting is that they within the urban parts of Brighton and Hove whose population grew rapidly in the 19th century.  In paintings, wind and water mills are usually depicted in rural settings and most surviving structures are in rural areas where nobody wants a block of flats.  Yet in many big towns, flour milling was an urban industry.  The Moulin Rouge in Paris maybe better known for its performance of selections from the works of Offenbach, but the theatre was built on the site of one of the many windmills providing the Parisians with flour.  19th century milling techniques produced flour with a short shelf life, flour produced in modern plant will keep for several months, thus it made sense to have mills close to the bakeries.

Well into the 20th century, corn was cut in the fields during August and September and then gathered up into sheaves to dry and later stacked in such a way to protect it from the weather.  There it remained until labour was available for threshing to separate the grain from the stalks.  Originally, threshing was done manually and provided employment farm labourers when there was no other work available.  As with many other agricultural tasks, machines were invented to do the work.  During the Second World War, one of the tasks of women in the Land Army was to operate threshing machines which were moved and powered by tractors.

The peak of windmill building took place in the first half of the 19th Century, the graph below was estimated from an article in Wikipedia:


Most mills were built when demand for food in the expanding cities was growing and farming was a prosperous industry.  In the second half of the 19th Century, two trends emerged which were to bring about the demise of wind powered flower milling, both of which are related to the rise of steam power.  Steam ships enabled bulk cargoes to be moved across the oceans cheaply, this allowed the large wheat producing regions of North America to access the British market which in turn led to a fall in prices and a recession in British farming. The ports where the imported grain was landed also had access to coal from the mining areas of North East England and South Wales.  Thus flour milling became one of the industries based on sea ports alongside electricity generation and gas works.

This post is related to my interest in the economics of sustainable energy.  Whilst wind is the only thing that a modern electricity generating wind turbine has in common with a flour producing wind mill, I thought it would be interesting to attempt to understand the economics of windmills.  First, it seems that whilst milling might be seasonal, it was not directly related to agricultural production.   Flour could not be stored for long but grain could, so the mills needed to operate throughout the year.  Secondly, windmills declined because of the lower cost of alternatives, of which the availability of cheap transport was a significant element.  Also, as town expanded, the sites occupied by windmills had greater value as sites for housing.


Sunday, 7 August 2016

The price of house coal


The starting point for this post was some old family accounts which extended, with gaps from the 1920s to the 1940s.  This was augmented by some figures found in the online version of Hansard.  Some local history material provided a human dimension to the numbers.

The graphs should be treated with caution as they are random in both time and location.  House coal can be priced in several ways, my family always discussed it in terms of cost per hundredweight (112 pounds or very roughly 50 kg).  In 1835 it became compulsory to sell coal by weight rather than volume, before that there are references to "chaldrons", this was a volumetric measure which might account for 0.5 - to 1.5 tons.

The economics of coal consumption are complex, at £10/cwt, the energy cost is around 2p/kwh which is lower than for gas or electricity.  However, the "benefit" derived from a kg of coal depends on the efficiency of the device in which it is burnt.  When used in a cooking range, a lot of energy is used just warming up a large lump of iron before the thing is warm enough to boil a kettle for tea.  Early ranges were not insulated, which made them inefficient cooking devices, but a desirable source of warmth in the kitchen, modern solid fuel range cookers are well insulated which minimizes heat loss.  In England, houses were heated with open fires which have a very low efficiency (10 - 20%?) with most of the heat going up the chimney.  From limited research, it seems that the French prefer stoves which use coal more efficiently.

During the 20th century, the overall trend in the "real" price of coal was upwards.  At the end of the 1960s coal began to compete with "North Sea Gas" in the domestic fuel market.  Gas was both cheaper and more convenient than coal and coal's share of the market started to decline.  By the end of the century, coal had become a "niche" product and costs rose as the economies of scale that had been possible faded away.

The retail price of coal has always been subject to wide variations and fluctuations.  In 1795 it was feared that France would invade England and for a time the price of coal was around 55 shillings per chaldron, this would be more than £50/cwt in today's money.  Households purchase coal for the heat it produces when burnt, premium grade Welsh Steam Coal might have a calorific value of more than 30 MJ/kg whilst that of lower grade fuel might be half that. Some of the variation in the price shown on the graphs is due to variation in the grade of coal.

Apart from events in the wider economy, the price of coal was determined by who you were and where you were.  A well-off, well managed household would buy several tons for delivery in large loads during the summer when they would benefit from lower prices.  At the other end of the scale, those on low incomes might have had to buy coal by the stone (14 lb) or lesser quantity and paid a high unit price (there is an analogy here with today's pre-payment meters).   Some coal merchants operated "coal clubs" which allowed fuel costs  to be evenly spread over the year.

Transport was a significant part of the cost of distributing coal from the mines to the consumer, by the late 19th century coal merchants were often clustered around railway goods yards.  The coal merchant was responsible for unloading the trucks, if this was not done within an agreed period, say, three days, the buyer was charged demurrage until the wagon was empty.  In the early part of the century it was not unknown for captains of collier brigs from the Tyne to run their vessels on to the beaches of seaside towns if they thought they could get a better price for their cargo than they would get at a port a few miles down the coast.  If the cargo was discharged at a port, then the buyer would have the cost of transport to the point of use.  There was always a risk that they could be stranded for several days until favourable weather and tide allowed them to re-float.

A wide variety of enterprises were active in the local coal markets, some companies operated across regions, some were local businesses, maybe just a father and son working together with a horse and cart and below them were the barrow boys.  Our family favoured the Co-Op, probably to get the "divi".

A coalman's job was hard and dirty, often it was delivered to the consumer in sacks containing one and a quarter hundredweight (roughly 60 kg).  Large houses would have purpose built coal stores and some town houses had coal cellars which extended under the pavement which could be filled through a hole normally covered by an iron cover.  The difficult ones were small terraces where the coal had to be carried through the house to the scullery, a task which had to completed without upsetting the housewife.


Saturday, 16 April 2016

A consumer's relationship with coal and gas

I recently read "the world did not run out of coal, it just stopped using it", with the implication that a similar process might take place with other fuels such as oil and gas.  A back-burner project has been to collect household energy costs from old utility bills and related sources (an unexpectedly fruitful source has been Hansard - the record of proceedings in the UK parliament).  This type of material shows how energy costs are perceived by the consumer.  Householders are generally rational in their decisions, seeking to minimize both cost and effort.

It is difficult to make prices comparable over time.  The purchasing power of money changes over time and there are different things to buy, so estimates of price change over a long period of time are an approximation.

This post is based on comparisons, but the data should be treated with caution because of the difficulty of making like-for-like samples.  In the days when coal was purchased by almost every household there were significant variations in price due to the quality of the fuel with nutty slack at the cheap end and anthracite at the other, the sources do not always quote the type.  Distance from the goods yard could be significant.  People on low incomes might purchase a stone (14 lb, roughly 6 kg) for cooking at a much higher unit cost than a household taking half a ton in a single delivery.


The price of coal in 2015 money remained more-or-less constant within broad limits for the period  1900 to 1970.

Gas is slightly simpler, but there were and are regional variations and in the post war period there was a transition from "town gas" made from coal and "natural gas" from the southern North Sea gas fields.  The nature of the gas industry is such that it is easier regulate, whilst there were a large number of coal merchants, there were relatively few gas companies, many of which where owned by town councils.  Most companies served a single area and there was limited competition.  Within the home, electricity displaced gas as the energy source for lighting by the 1930s.  The main uses for as were for cooking and until the advent of central heating in the post ware period, gas fires were a common way of heating a room. 

The availability of gas from the North Sea started a 40 year period of low energy prices which lasted form approximately 1965 to 2005.

A cursory reading of Hansard suggested three things.  First that energy prices are a constant source of public, and therefore parliamentary concern and that this is accentuated in difficult economic times.  Secondly, that there is a general distrust of energy suppliers, coal merchants in the 1920s were attracting much the same criticisms as today's gas and electricity suppliers.  What politicians of all persuasions seem to want is a regulated energy market which is isolated from global economic turbulence.  Sustainable technologies go some way to meeting this requirement.

The householder does not purchase a hundredweight of coal or a therm of gas, he/she buys warmth and the facility to cook.  Open fires accounted a for a large proportion of the coal burnt in England, whilst a coal fire is cheerful and comforting, it's thermal efficiency is low, possibly less than 20%, stoves equipped with a back boiler were more efficient, but a large amount of heat still went up the chimney.  Modern stove designs seem to be a big improvement on those of the 1950s and 60s.  As a gross oversimplification, someone wanting 1 kwh of warmth might have to purchase enough coal to produce 4 kwh if the fireplace was 25% efficient.  Gas central heating boilers might offer 90% efficiency.  Making assumptions about thermal efficiency produces this graph which shows the effective energy cost of  coal and gas assuming thermal efficiencies of 25% and 90% respectively.


The crossover point is sometime in the 1960s, this is when our parent's generation blocked up the fireplaces and installed gas central heating.  Gas was not only cheaper than coal, it was cleaner and easier to live with.  Another benefit of gas was improved air quality, well into the 1970s thick fogs were a frequent occurrence due to the high proportion of soot particles in the air.  This in turn provided a decrease in respiratory disease.

The sustainable energy technologies sit uncomfortably with economics, the transition from coal to gas was largely driven by the cost advantages, my source for this comment is my parents and their friends.  If a similar transition is to take place from gas to sustainable sources, the energy consumers, who are now our children, must perceive some economic benefits.


Saturday, 20 February 2016

Economics, LED Lighting and Sustainability

Economics and sustainability do not sit comfortably together.  Fossil fuels are convenient and after more than a century of development the devices which consume them are reasonably efficient and in some respects cheap.

Things that are tagged as "sustainable" or "green" often have a premium either paid directly by the owner or indirectly by a third party in the form of a subsidy.  Ideally, sustainable technologies should deliver the same benefits for the same cost as traditional technologies.

My experience with LED lighting suggests that it meets these criteria.  I bought my first LED lamp approximately 4 years ago and it did not win the hearts and minds of my family.  I'm guessing but I think it produced 50 - 60 lumens per watt which was only a modest improvement on CFLs which lit the house, however, the real problem was the fact that the light came from a surface rather than a sphere, thus the diffuse light reflected from ceilings was lost.  About two years later, some small LED globes started appearing with an output of around 400 lumens and maybe an efficiency of 60 - 70 lumens/watt.  These worked well and some 10 watt CFLs were replaced with 5 watt LEDs.  Recently, the "right" product appeared in the form of a globe lamp with an output of around 900 lumens and an efficiency of 90 - 100 lumens/watt.  We are now replacing 20 watt CFLs with 10 watt LEDs.

The benefits of moving from CFL to LED appears in the electricity bill, we currently consume about 1,500 kwh/year making the bill, excluding standing charges, roughly £250/year.  I extracted the graph above from my account on the energy suppliers website.  It needs treating with caution as I'm not sure it compares like-with-like.  I'm guessing that the "similar house" means one in the same postcode area and that the "efficient house" is the lower quartile for that postcode area, so all the graph tells you that our home uses electricity than our neighbours, possibly because we have LED lighting.

Let's take this experience to some illogical conclusions.   Say, an investment of £250 in LED lighting reduces a home's electricity consumption by 200 kwh/year most of the reduction taking place in winter when the demand for energy is highest.  Compare this with a hypothetical rooftop PV installation costing, maybe, £5,000 which produces 2,000 kwh/year mostly during the day in summer when the demand for energy is lowest.  Which technology gives the best environmental outturn?


Friday, 28 March 2014

Timing is everything

A common measure of sustainability is the percentage of energy generated from renewable resources such as wind, solar, tidal, hydro, bio-mass etc.  Often the time period on which this statistic is estimated is a year.  Equally important is the timing of supply and demand.  The classic example is solar generation, the graph below illustrates the demand for electricity on a typical spring day and the solar irradiance available to contribute to meeting it, a similar graph could be drawn for wind and the time period extended to include seasonal variations.

The two ways of meeting the overnight demand are storage and alternative means of generation.  Most energy economies are evolving to adapt to diverse means of generation.  At the present time it is hard to make a good case for storage as most energy economies can absorb what wind and solar installations can offer them and frequently, they are given priority when working out how to meet demand.  In general, there are few surpluses of energy which can be accumulated in a storage system, even if such a system is available.  I don't have a handle on the relative risks and economics of utility scale storage and generation, but at a guess, maintaining a fossil/nuclear generating capability is the "low" risk option.  The approach makes wind and solar sources incremental parts of the energy mix which need backing up with an equivalent amount of conventional capacity.

The case for storage is that it is a step towards sustainability.  At its most basic, the harvest from solar panels during the day can be stored and used to keep the lights on after dark.  Within the arid regions towards the equator, where there a clear skies and relatively small seasonal variations, this could be a workable scenario.  In the temperate regions, more complex system are needed with a mix of solar and wind.  Solar works well in summer, but the winter yields are low, wind works better in winter and on some days neither produce very much.

I'm currently messing with a very small scale storage project in which a small computer attempts to keep itself alive by "buying" sustainable energy, this could be done as a computer similar (which is happening as a parallel task), but the having some hardware, makes it both fun (other relevant words are frustrating and expensive) and more instructive than a bunch of numbers from a computer programme.  There in one economic nicety, you can attempt to use off-peak electricity which is approx. 7p/kwh where possible in preference to normal daytime rates which are close to 20p/kwh.  If you used this approach to ensure that a high proportion of the electricity you use was from renewable resources, you would have some capital and operating costs beyond those normally associated with turning the lights on.

Living next to a railway station used by commuters, I've become aware that there are an increasing number of electric cars around, typically, these are priced at around £20k after a £5k government subsidy.  Apart from their high cost, electric vehicles charged by off-peak electricity are an attractive concept, in effect they are storage on wheels.  An interesting policy study would be the  effect of providing similar support for including storage into homes and offices.


Friday, 14 February 2014

Wind - Going off at a tangent

When I first became interested in the contribution wind and solar energy could make to a sustainable energy economy, a good starting point seemed to get an understanding of the energy available for conversion into heat or electricity.  There is a lot of good wind data available in the public domain, so I started plotting out out wind speed distribution diagrams like to one below for a randomly selected group of worldwide locations.

As is the way with these things, one question leads to several more.  The first concerned the sample.  Most "good" data is collected not amuse spreadsheet addicts, but to assist the safe passage of ships and aeroplanes which tend to operate from open, uncluttered spaces and often produce neat and tidy datasets which can be modelled with the Rayleigh or Weibull distribution (the Rayleigh distribution is a special case of the Weibull distribution in which the shape factor is constant at 2.0).  Even without attracting attention to oneself by cycling around with a wind speed meter, it became clear that the wind speed distribution in places like backyards and some other parts of the urban and rural landscape where more complex.


Terrain is a factor in determining the amount of wind energy available at a given location.  The average wind speed and distribution will be different at the floor of a valley from that at the ridges either side.  These comments are drawn from work in progress from which as yet no definite conclusion as been drawn, thus they should be treated with caution.  In general, offshore wind polewards of the tropics has a higher average speed than onshore and approximates to a Weibull distribution with a shape factor of 2.0.  Onshore at a similar latitude, the average wind speed is lower than offshore and its distribution more skewed to the left, in terms of the Weibull distribution, the shape factor is often in the range 1.3 to 1.8, the higher values being associated with flat, open areas.

In an attempt to explore the effects of terrain on the distribution of wind speed, I plotted small contour maps using data from the SRTM mission, like the one shown below which is centred on a windmill close to where I live..


I've had to put this work to one side for a few months, but not being the most disciplined of researchers, I wondered if the software used for the contour plots could be used to give an insight into the location of windmills.  In reality, this was going off at a tangent, but the logic was that windmills are found in places for which there is no readily available source of wind speed data, thus studying their location would be an interesting way of looking at terrain and wind, this work has also been moved to one side, but I am looking forward to returning to it.


Wikipedia has some excellent lists of windmills from around the United Kingdom, and in may cases does the tedious task of converting National Grid coordinates to lat/lng relative to the WGS84 datum which are compatible with the SRTM data.

Windmills are part of the English landscape, especially in the eastern counties, but I was surprised at the number of them, maybe 2,000 (a guess) with the majority being built and operated in the 19th Century.  At the beginning of the 20th century, the windmills were displaced by factories powered by steam, oil  or electricity.  For there to be so many windmills in operation, there must have been a substantial industry dedicated to their construction and maintenance together with a knowledge of the relationship between terrain an wind energy, I would be curious to know if there was a reference work on this?

In a week in which the UK has been lashed by some of the most violent storms in living memory, it should be remembered that the wind machinery has to survive under considerably harsher conditions than it normally operates.  In storm conditions, wind turbines shut down in an attempt to minimize the risk of damage.


Friday, 3 January 2014

Starting over

Not too far from where I live is a house that was built sometime in the 1980s, I guess it was none too comfortable to live in.  Whilst it was being partially demolished, I did not see any signs of insulation, just a lot of windows with rotting frames and a load of rusting radiators.  Technically, it is being extended, but in reality, it is being rebuilt.  The roof is well insulated, the walls have a 100 mm layer of polystyrene and the windows are double glazed.  Not wanting to be a nosey neighbour, I have not enquired about the heating system, however, I know that a wood burning stove was installed in a similar development and has yet to be lit.  Retrofitting a property to that standard would be difficult and expensive and unlikely to pay-back.  That statement is based on a study of my own home where you could spend a lot of money, not be much warmer and would lose the character of an airy Edwardian semi.

Sustainability is much easier to attain with a clean start.  I am currently working on (more accurately "staring at") an electrical storage project.  Storage is one of the key components in a sustainable energy economy, but batteries are DC devices and my home is wired for AC.  AC is a logical choice for distributing electricity, but increasingly it is consumed at DC.  Some time back I did a quick survey on how we use electricity in our home and produced this graph, this suggested that only 15% of electricity has to be consumed at 240 volts/AC or in other words the washing machine and vacuum cleaner.  Some things like the fridge are available in low voltage DC forms, computing and entertainment devices all have power supplies to shift from high voltage AC to low voltage DC.  We are slowly migrating the lighting from CFL to LED devices.  Each LED light bulb has its own power supply circuit for AC to DC conversion.

Even though most things use low voltage DC, distribution within the house is 240 volts AC,  That was a logical way of doing things in the 1920s when electricity was first installed and all appliances used AC, the better part of a century later, there may be some value in examining household distribution. 

If storage were to be part of the household energy system without any radical changes in wiring, the first step would be go from 240 volts AC to 12 or 24 volts DC for battery charging, the battery would be connected to an inverter to get back to 240 volts AC to go through the ring mains, devices connected to these would then drop it back to low voltage DC.  This would be a complex and inefficient system and one which is not going to get built any time soon.  The small DC storage project is all DC, albeit with some level shifting, and is relatively simple.

I stumbled over another example of the complexity of legacy systems.  When the railways moved from steam engines to electric motors, high voltage DC was chosen because at the time only DC motors could provide the high starting torque needed to get a train moving.  Modern electric trains (so I am told) use AC motors.  Thus the grid feeds trackside substations with AC, this is converted to DC for the trackside rails, the train then converts it back to AC.  I doubt if the losses in this system are great, but the result is a complex system with DC for traction and 3 phase AC for everything else.

In the UK there is a debate over how to curb emissions which can be grossly oversimplified to nuclear versus the renewable technologies such as wind and solar.  My own view is that there should be different paths for "old" systems and "new" developments.  For the legacy systems which are based on large amounts of uninterrupted energy from fossil/nuclear sources, the key technologies are conservation and energy management.  It is valid to determine if it is possible, practical and economic to build new systems which are more or less dependent on renewable resources which are discontinuous (the Sun does not shine at night and the wind does not always blow), these would incorporate appropriate technologies, e.g. LED lighting and storage.  It's so much easier to design these things from scratch and not have to mess with the past.


Friday, 20 December 2013

The Winter Solstice

This is was written a few days before the Winter Solstice when the day is short and the Sun is low in the sky.  It is the time of the pre-Christian festival of Yule, regardless of one's religious beliefs, this is a time of year when the spirits need lifting from the cold and damp with parties and festivals.  At present I feel a strong desire to keep warm by setting fire to something that died a few million years ago.

Most religious festivals are linked in some way to the land and climate in which they are celebrated, for example, Candlemas (Feb-2) coincides with the time the soil starts to warm after the winter and Easter marks the start of the growing season and so on.  Whilst these events were once marked in some way, we increasingly isolate ourselves from seasonal variation with central heating in winter, air conditioning in summer and strawberries in November.  This process started with the large scale use of coal at the start of the Industrial Revolution around 1750.

The graph shows the estimated clear sky irradiance over Southern England at the time of the solstices and the equinoxes.  The energy yield at each time is proportional to the area under the curve, or to put it another way, its cold in winter and warm in summer.  It is possible to do similar things with wind.

We are an urban and industrial society and there is not going to be a return to the rural idyll (if it ever existed) any time soon.  Yet understanding and appreciating the climate and economy in which we live can lead to good designs and better decisions.  The sustainable energy economy is a big challenge and it is important to realise what can be achieved.  Industrial and urban economies need continuous supply of energy, part of the base load created by street lighting, transportation, schools, hospitals, data centres, pub signs etc..  I suggest that there is little public support for a railway system powered solely by wind turbines.  Sailing ships were displaced by coal fired steamships because they could run to schedules and were big enough to accommodate all who could afford to travel.  This base load will be underpinned for the foreseeable future by fossil/nuclear generation. Within that sector of the energy economy, the key elements are conservation, management and storage, implementation of which is not helped by legacy systems.

I'm embarrassed to admit it, but some of my interest in sustainable energy was sparked by the 1970s BBC TV series "The Good Life" in which an attractive young couple unimaginably named Tom and Barbara Good, but played endearingly by Richard Briars and Felicity Kendal attempt self-sufficiency in Surrey.  Needless to say the challenge was a rich source of humour.  My wife is too well grounded to let me indulge in such fantasies so I have contented myself with a paper project to provide 1 kwh per day from renewable sources without costing the Earth.  Whilst pondering this problem, I have learnt how to mount transistors in TO 220 cases, a little about controlling them with a computer, but I'm still struggling.  My backyard almost makes us self-sufficient in garlic and provides a small supply of vegetables of the type normally discarded by supermarkets but as a source of wind and solar energy it is a sad disappointment.

The path of helium filled balloons which have escaped from young partygoers suggests that at around 500m there might be a steady wind, but the neighbours, tolerant in many ways would not accept an airborne wind turbine.  A boat on a river estuary might work, but my wife is too well grounded to let me indulge in fantasies.  The obvious solution is to buy electricity from people who generate it from wind, solar and other sustainable sources and use the grid as a delivery system.  But energy from these sources is a natural product whose availability changes with the seasons.


Thursday, 12 December 2013

How do you learn about this stuff?

I first became interested in sustainable energy around 2005.  This was before the financial crisis of 2008 when environmental issues were aspirations, not perceived as costs (maybe I exaggerate).  A 2.5 kw rooftop PV installation cost between £15k and £20k and there were no feed-in-tariffs, not surprisingly there were not many to be seen.  DIY superstores were selling 1 kw wind turbines for around £1,500 (I think) and there were stories in the press expressing horror at the low yields, this was not surprising considering that rating was usually for wind speeds around 15 m/s (approx. 30 mph), whilst this is not a gale, its the sort of wind you don't feel too often (for which many of us are grateful).  I struggled to understand this stuff.

Most of my working life I've been lurking in the shadows between technology and economics.  A traditional engineering education did not include economics and the attitude towards its practitioners was illustrated by graffiti  in engineering faculty toilets above the loo roll dispenser which read "Economics degree, please take one".  However, there was an implicit understanding that there should be a link between technical performance and economic benefits, however dubious.

My perception of wind and solar energy systems is that they are conversion devices, the input is "weather" e.g. wind, sunshine, cloud etc. and the output is electricity or heat.  Attempting to understand this relationship has led to the combining bits of wood, drain pipes, Meccano and a sketchy knowledge of electronics into experiments.  I realise now that I must have been a sad disappointment to those burdened with teaching me carpentry, metal work and technical drawing, be grateful that I trained on aircraft engines and did not become a kitchen fitter.

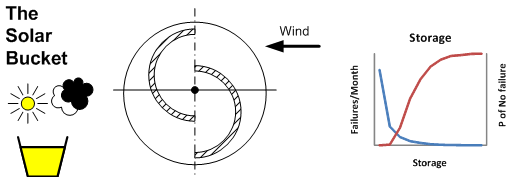
My first attempt around 2007 was the "Solar Bucket", this consisted of three components, a small solar panel, a lead acid battery and several devices to use the energy harvest, the most useful being an early LED light.  The photo shows the panel on a winter's day.


This provided some valuable experience.  It illustrated seasonality, the effects of clouds and much more.  The battery component was originally intended as a measurement device.  I was a little slow to realise it but the battery was the important component, storage is a key element of a sustainable energy economy.  I've heard several people say things like "I want solar panels to make me independent of the energy companies" (or variations n the theme), but the Sun does not shine at night, so without storage they are as dependent on fossil/nuclear fuel as the rest of us.  I argue that investment in energy storage would give a better outcome than more rooftop PV.  As I write this I am staring at more plywood, batteries and wires designed to act as a realistic load for energy management software.

Instructive as the "Solar Bucket" was, it did not act as a resource meter.  This resulted in several attempts at making radiometers.  Initially, these used light dependent resistors and did not work, as these are successfully used in cameras and other devices, the problem was my lack of knowledge.  At some point I purchased a batch of small, flat monocrystalline PV cells for about £1 each and these work well.  The current device could be described as a shaded radiometer and for some reason it attracts the attention of dogs.  The concept is simple, a horizontally mounted cell measures global irradiance, then a shade is placed between the sun and the cell, it then measures diffuse irradiance.  Combine these two measurements with Sun-Earth geometry and you can get an estimate of the direct beam irradiance.

I'm trying to estimate the accuracy of this device, but it suggests that the water content of the atmosphere has has a significant effect on irradiance and particularly diffuse irradiance.  There are some good models of clear sky irradiance, but some of these require data which is not readily available or are related to the climate in which the observations were made, this is an attempt to understand my own back yard.

The first radiometer was simply a PV cell shorted with a resistor, the current and therefore the irradiance was measured by measuring the voltage across the resistor with a multimeter.  For several months, I took readings with the cell horizontal with it angled at approximately 50 degrees to the horizontal.  Under a clear sky, pointing the cell in the direction of the Sun increases the output, this maximises the yield of solar devices in summer, but in winter, the English sky is often full of thick stratus cloud, on these days, the output of the PV cell was greatest in the horizontal position.  The object below was constructed to explore this further.


It consists of a light dependent resistor mounted at one end of a length of waste pipe which is mounted so that measurements can be made around the sky's hemisphere.  On an overcast day, the diffuse irradiance was equally distributed about the the sky, whilst on a clear one it was principally from the direction of the Sun.  This suggests that the yield from PV devices in an English winter might be maximised by mounting the panel horizontally.

My home is located on the western side a a valley in an area where the prevailing wind is from the south west, so we are fortunately sheltered from much bad weather.  Whilst solar is a back yard technology, observing the wind means leaving the house.  A lot of wind speed data is collected in clear open space such as airports, offshore buoys and weather balloons.  The data from these sources often relates to the flow of air over a relatively smooth surface and can have little or no relationship with the wind in nearby urban or rural environments.  In these places, the wind eddies around buildings and trees and neither the speed or direction is constant.  In this type of environment, vertical axis wind turbines offer some advantage.  I horizontal axis machine in an urban setting will often "hunt" for the wind, by the time it has aligned itself with the flow, the gust has dissipated.  I was first introduced to the Savonius design by a university friend from the Caribbean, whilst we were taught about marine, automotive and aircraft engines, simple devices for working irrigation pumps got little or no attention.  The Savonius device has two attractive features, the first is that it is not subject to the complex forces seen in other vertical designs, the second is the ease of construction.  In the West Indies they are often made by cutting a 40 gallon oil drum into two, then welding it back together so that it looks something like the model in the photo below.

A few happy days were spent cycling around the city and taking this model to the top of multi-storey car parks, to the end of breakwaters  and occasionally attracting the attention of dogs.  If you are a man wanting to attract women, borrow a puppy, if you want perfect solitude get a model wind turbine.

I did spend some time messing with a dynamometer for the Savonius model, but abandoned it when I realised that I would have little use for the data.  The Meccano tower lingered in my work room reminding me of the value of time.

What have I learnt?  The main lesson is that a sustainable energy economy is complex, its not just a case of shutting down nuclear power stations and seeding the countryside with wind turbines and putting a solar panel on every roof.  Its a blend of realistic expectations, generation, management and storage which is a large technical challenge, but so was developing the technology for nuclear power stations so we've been here before.  Also don't ignore economics, there is a belief held by some well meaning people that sustainability is above economics, one man's feed-in-tariff is another man's economic cost and this does not lead to good decision making.

Its quite possible to do a lot of experiments with limited resources.  The basic rule is to make mistakes cheaply and realise when you are wasting your time.  I put a lot of effort into a solar thermal device, this had a collector area or half a square metre, looked quite impressive but was useless for anything other than drying washing.  A series of small panels each 10 cm square cost very little and were quite instructive.


Friday, 6 December 2013

Wind is Moving Gas

A recent review of an electric car could be summarized as "This vehicle is not petrol driven".  Like a lot of things energy related, electric vehicles are not a simple swap from an old technology to a new one.  I have never owned or driven an electric vehicle so this is a framework which I might use to evaluate one, a sort of automotive lit-crit.


Most reviews of electric vehicles focus on range anxiety, at a guess this is more do with opportunities to re-charge than the distance/charge, typical numbers seem to be in the 100 - 200 km range.  I live in an area of controlled parking which is next to a railway station.  A statistically invalid survey of the parking permits of the vehicles in our road, suggests that 40% have travelled less than 1 km and that the remaining 60% have travelled less than 5 km and are parked in a garage or driveway at night.  The record shortest journey is 150 metres.  Whilst many of these vehicles are capable of crossing continents, most don't.  Whilst I have not lived in the US, I have spent a lot of time working there driving the American Dream (a.k.a. a Dodge Neon), even with a full schedule it was rare to travel more than 150 km in a day.  so with the significant exception of family holidays and trips to granny, range for many people is not an issue.

Cost is harder to deal with.  Half an hour of Googling and doing things with a pencil resulted in the following conclusions, first that electric cars are expensive to buy and secondly if charged up on-off peak electricity, cheaper to run.  What that does for my wife's 40 km commute is not obvious.

A neighbour recently described me as an "eco" because I rarely drive and prefer my bike, but I'm male and therefore lust after low slung sports cars (although my car-boot bike maybe quicker around town, sadly, beyond the city limits its not a contest).  I might drool over a Tesla.

I dispute the claims that electric vehicles produce zero emissions.  In the UK electricity is produced from a variety of sources including coal, gas, nuclear, wind and solar, last time I looked, CO2 emissions were around 0.4 to 0.5 kg/kwh for the country as a whole.  The environmental issues are at the point of generation not the car.  The fuel for electric vehicles is coal, gas, nuclear, wind and solar rather than petrol.

In the context of a sustainable energy economy, electric vehicles offer personal transportation using renewable sources such as wind and solar.  Equally important is that they are mobile storage devices.  A typical car spends 5% of its time on the road and 95% waiting to go somewhere.  Wind and solar sources produce energy at the whim of the weather and fossil/nuclear sources are most efficient at a constant load, this is why off-peak electricity maybe half the standard price.  The storage capacity of electric vehicles could be used to improve energy management as a peripatetic part of a smart grid.

At present, the case for electric vehicles is not proven, a situation made more complex by the availability of subsidies.  Subsidies are a good economic tool to bring about change, but they can also be proof of the doctrine of unforeseen consequences.

A not to close look at the electric vehicles on offer suggests that they "not petrol driven".  As electric vehicles are a new technology, maybe the starting point should be elsewhere.  A few times when I have been meandering through the countryside I have been overtaken by a golf buggy.  These vehicles cost around £4,000 (I think) and have been adapted for use on the Moon, so making them fit for the daily commute should not be too great a challenge.  A vehicle costing £5,000 with low running costs and a range of 200 km would be the car most people need, but maybe, not the car they want.  However, make a low slung version with good curves and you have a Sinclair C5 - Who said they were a bad idea?

Safety on the roads is an issue and the ability to survive a collision is important, once you have been in accident, this is not an academic concern.  Much as I love my bike, I am acutely aware of it's vulnerability and I nag my children to wear cycle helmets.  The city I live in is flirting with 20 mph speed limits, does a 20 mph environment offer the potential for lighter vehicles?

Postscript

After I finished this post, I saw an innovative electric trike, driven by a combination pedals and an electric motor fuelled by four lead acid batteries and a Mars bar.  I gave chase, but quickly lost contact before I could ask the owner's permission to take a photo.


Friday, 22 November 2013

A Brief History of Walls

Much of the housing in the area in which I live was built in the period 1870 to 1910.  Over the years gaps have appeared and the suburb has expanded to displace sheep from the surrounding farm land.  New houses have appeared on the lawns of grand houses, small orchards, market gardens and in a couple of places the side of a hill.  Whilst the style of building has changed, it is only in recent years that the method of construction has evolved.

The driving forces behind this evolution has been the Building Regulations and a change in the nature of home economics.  Prior to 2000, the general philosophy was to focus on capital costs, fuel for heating which is a major components of a home's operating costs was relatively cheap and a common way of getting a warm home after the arrival of North Sea Gas was to install lots of radiators.  This was not significantly different from the attitude of the Victorians who believed in the health benefits of ventilation and and whose homes needed a good supply of air to keep open fires burning, for them coal was relatively cheap.

Modern houses are built on a completely different principal, they have a higher capital cost but are intended to have much lower operating costs, not only that they are warmer.  The sketch below shows the difference between an old wall and a modern one.  For well over a century, the most houses were built with cavity walls which are just two single brick walls separated by an air gap and the inner wall finished with plaster.

Modern walls are significantly different, the outer layer of bricks might be similar, but the inner wall consists of a layer of foam insulation in front of blocks with good thermal properties and the finishing is insulated plasterboard.  In very rough numerical terms, old walls may have had U value greater than 2.0 watts per metre squared per degree C. whilst that of a modern wall will be less than 0.5.  In non-numerical terms you don't need much heating.  A proud owner of such a building I met recently did describe an alternative to a gas central heating boiler as a form of heating, but that may have been wishful thinking.  The sketches are not from the studying of Building Regulations, but the result of staring into building sites whilst walking my dog.

It is not only the construction of walls which has changed, but doors, windows, roofs.  Double glazing in sealed frames is now the standard and the thermal properties of these are significantly better than a single glazed sash window.

As someone interested in the concept of a "sustainable energy economy", I am sometimes puzzled by focus on energy generation.  I occasionally do a non-scientific survey of the contents of "science and environmental" sections of the media.  The stories range from the bizarre such as "Wind Turbine catches fire in Gale", "Planning permission application for new solar park", "Minister declares offshore wind farm open" and similar.  Only rarely is there an article on conservation or storage.  Its not hard to see why, few journalists or politicians can make much of a house brick, LED light or boiler controls.  Apart from a famous photo of Winston Churchill building a wall, I can't remember any interesting picture of an MP gazing lovingly at a brick.

Postscript

Shortly after I posted this, I heard a news report stating that during the prolonged winter of 2012/13 there had been 30,000 excess deaths (meaning more than normal) and that many of  these were due to old people living in cold homes.  In part, this is due to the way homes were constructed when energy was relatively cheap and plentiful.  Now that this is no longer the case, many homes, especially those of pensioners on low incomes are underheated.  Whilst I don't want to dismiss the value of retro-fitted insulation, in many cases a modest expenditure only makes the house less cold, not warm and does not cut energy bills.  Over a very long period, many thermal disasters will fall down or be demolished, but that will not do much for the generation currently living in them.  It would help if policy makers understood the problem and not ranted on about the imperfect working of the domestic energy market.


Friday, 15 November 2013

Gas Prices - A Family History

I'm peeling away 110 years of interior decorating events in our home's main bedroom. At one point, the floor and walls were dark green, which may have seemed like a good idea at the time.  The locks on the door are were installed by someone with an unhealthy interest in privacy.  Maybe because of these locks, the door was once broken down, I suspect by a jealous lover.  Below the floorboards are three generations of electrical wiring and some plumbing described by a plumbers' merchant as "old school" which may have been installed in the 1970's.  Amongst the filth are the butts of a few "Woodies" and the remains of a fag packet.  The original fireplace was broken up with the skilled use of a 4lb club hammer and the hole blocked up. After a morning of bizarre behaviour I managed to recover a hand painted tile from the debris.  The piping for the original gas lighting appears to be more or less intact, although the fittings have long since disappeared.


There is a subtle harmony in the layout of the room. The bed was positioned to make the most of the early morning sun, the coal fire would have warmed the feet.  The gas lights on either side of the bed are perfectly placed for a book at bed time.  Maybe there was once a dressing table lit by the other gas light where the lady of the house did her makeup and needlework, a hint of her perfume remains.

Electricity was present in the house when it was completed in 1901, not for use as heat or light, but for signalling.  The three main bedrooms had bell pushes which probably connected to an indicator board in what was then the kitchen.  The house is neither large nor grand, but there may have been a live-in cook and this poor woman may have had to provide room service, but she did have the warmest room in the house to work in. The lead-acid batteries which powered this system would have been charged by one of the local shops.

The bedroom illustrates the roles of electricity, gas and coal in the Edwardian energy economy.  More than a century later we use these differently.   Gas is now the principal domestic fuel and its price is increasingly becoming a cause for concern.  The graph of domestic gas price below was compiled from from a collection of family documents:
This graph spans the period from 1928 to 2013.  I am attempting to fill in the gaps, but anecdotal evidence suggests that gas prices fell slowly in real terms during the period 1950 to 2000.

The conversion from money-of-the-day to 2011-money is based on the UK government's Composite Price Index, the attraction of this scheme being the availability of a long time series (one version extends back to 1750).

At the start of the 20th Century, gas was mainly used for lighting.  Coal was the principal domestic fuel for cooking and burning in open fires. The gas came from gas works, often located close to town centres and near a railway line. The economy of gas works was based on a combination of the sale of gas for lighting and coke for heating. By the 1920's gas stoves were rapidly replacing solid fuel ranges.  Simultaneously electricity was displacing gas as the energy source for lighting. Electricity was a much more versatile fuel than gas, it could be used for cooking, lighting, appliances and heating.  The relatively high cost of electricity limited the popularity of electric fires. By 1939, many houses were using electricity for lighting and appliances, gas for cooking and coal or coke for heating.

During the war years, domestic energy consumption declined. Coal was often difficult to obtain, the blackout discouraged the use of lighting and many men and women were away from home either working in the factories, on the land or serving in the forces.  After the war, the availability of energy for domestic consumption increased as war production ceased and the lights were turned on again and houses became warmer.

 In the 1950s, electricity was produced in increasingly larger power stations and distributed by a national grid. Gas was still produced and distributed locally, it was not until large volumes of natural gas were discovered in the Southern North Sea that a national gas distribution network was established.  The North Sea reserves stimulated a "dash-for-gas" and the role of gas in the energy economy changed significantly.

 By 1980 gas had more or less displaced coal as a domestic fuel. This transition was driven by a combination of low cost and convenience.  Anecdotal evidence suggests that domestic heating costs dropped with North Sea gas but there were two other driving forces.  Not least was the ease of  use. Whilst the occasional coal fire is pleasant, heating a house with coal is a labour intensive process requiring coal to be carried, grates to be cleaned and ash to be dumped. Also, for many years fog and smog in urban areas had been a public health problem and the advent of smokeless zones in towns discouraged the burning of coal.

The availability of low cost gas lead to its increased use as fuel for electricity generation.  By the beginning of the 20th century, the UK was ceasing to be self-sufficient in natural gas and imports either by pipeline from Europe or as LNG from the Arabian Gulf and elsewhere have been increasing.  The result of this is that the gas price is now set by international markets.

Friday, 25 October 2013

Energy Storage and Vegas Values

Energy storage is the buffer between supply and demand.  Wind and solar sources are weather dependent systems whilst home and work life tends to follow a more or less predictable routine.  Whilst the ancient mariner or miller might have taken a duvet day when the wind was not blowing, the office worker is expected to be at his/her desk when the weather outside is fair or foul.  Storage is a key component in renewable energy systems.

Monte Carlo simulation is one way to explore the interaction between supply, demand and storage.  The concept is simple, you throw random events as a mathematical model and see how it behaves, whilst this may sound abstract, its more than a bit like real life.  The name was comes from the roulette wheels in the casinos of Monte Carlo in the 19th century, in a fair and decent world, these devices are true random number generators.  If the technique was being named today, it might be called Vegas Values.

The example is based on a simplistic model of a system with three components, a small wind turbine, battery storage and a load. The example has been set up such that the average supply and demand are both 1 kwh.day, however, the distribution of  the supply and demand are different, and it is probable that on any given day, supply and demand will not balance. There could be large demand for energy on a calm day or little demand on a windy one. The inclusion of storage in the form of a battery helps match supply and demand. In this example, we want to understand the effect on system reliability for different amounts of storage.


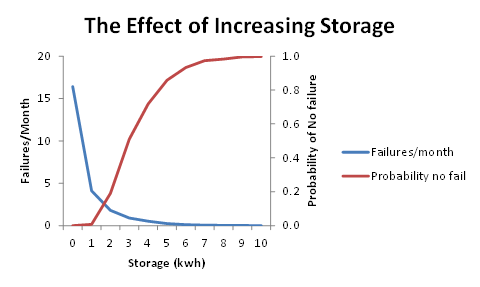
Over a given 30 day month, the wind turbine produces an average of 1 kwh/day, this supply is assumed to be a triangular distribution with a minimum of 0, a  mode of 0.5 and maximum of 2.5 kwh. This supplies a 100% efficient battery, the capacity of which subject of the simulation. The model was run with storage capacities ranging from zero (no storage) to 10 kwh. The load is also 1 kwh/day and also modelled as a triangular distribution, the minimum, mode and maximum values are 0.5,1.0 and 1.5 respectively. The system "fails"; when the battery cannot supply the load. The parameter of interest is the number of days per month the system fails, which can also be expressed at the probability of the system not failing during the month.

The core of the model is shown in the flow chart:


This is a very simplistic model, so a single function is used to return a triangularly distributed random number, the arguments being the minimum, mode and maximum values. The Python code for this simulation can be found on our website. The principal variable is "storagesize" which is the capacity of the battery in kwh. The output of the program was used to create the graph below.

This simplistic model of a hypothetical system suggests that increasing storage reduces the probability of system failure but at the amount of storage increases, the law of diminishing returns set in.

Related Material

Monte Carlo Simulation

Triangular Distribution