Pages

Friday, 6 December 2013

Wind is Moving Gas

A recent review of an electric car could be summarized as "This vehicle is not petrol driven".  Like a lot of things energy related, electric vehicles are not a simple swap from an old technology to a new one.  I have never owned or driven an electric vehicle so this is a framework which I might use to evaluate one, a sort of automotive lit-crit.


Most reviews of electric vehicles focus on range anxiety, at a guess this is more do with opportunities to re-charge than the distance/charge, typical numbers seem to be in the 100 - 200 km range.  I live in an area of controlled parking which is next to a railway station.  A statistically invalid survey of the parking permits of the vehicles in our road, suggests that 40% have travelled less than 1 km and that the remaining 60% have travelled less than 5 km and are parked in a garage or driveway at night.  The record shortest journey is 150 metres.  Whilst many of these vehicles are capable of crossing continents, most don't.  Whilst I have not lived in the US, I have spent a lot of time working there driving the American Dream (a.k.a. a Dodge Neon), even with a full schedule it was rare to travel more than 150 km in a day.  so with the significant exception of family holidays and trips to granny, range for many people is not an issue.

Cost is harder to deal with.  Half an hour of Googling and doing things with a pencil resulted in the following conclusions, first that electric cars are expensive to buy and secondly if charged up on-off peak electricity, cheaper to run.  What that does for my wife's 40 km commute is not obvious.

A neighbour recently described me as an "eco" because I rarely drive and prefer my bike, but I'm male and therefore lust after low slung sports cars (although my car-boot bike maybe quicker around town, sadly, beyond the city limits its not a contest).  I might drool over a Tesla.

I dispute the claims that electric vehicles produce zero emissions.  In the UK electricity is produced from a variety of sources including coal, gas, nuclear, wind and solar, last time I looked, CO2 emissions were around 0.4 to 0.5 kg/kwh for the country as a whole.  The environmental issues are at the point of generation not the car.  The fuel for electric vehicles is coal, gas, nuclear, wind and solar rather than petrol.

In the context of a sustainable energy economy, electric vehicles offer personal transportation using renewable sources such as wind and solar.  Equally important is that they are mobile storage devices.  A typical car spends 5% of its time on the road and 95% waiting to go somewhere.  Wind and solar sources produce energy at the whim of the weather and fossil/nuclear sources are most efficient at a constant load, this is why off-peak electricity maybe half the standard price.  The storage capacity of electric vehicles could be used to improve energy management as a peripatetic part of a smart grid.

At present, the case for electric vehicles is not proven, a situation made more complex by the availability of subsidies.  Subsidies are a good economic tool to bring about change, but they can also be proof of the doctrine of unforeseen consequences.

A not to close look at the electric vehicles on offer suggests that they "not petrol driven".  As electric vehicles are a new technology, maybe the starting point should be elsewhere.  A few times when I have been meandering through the countryside I have been overtaken by a golf buggy.  These vehicles cost around £4,000 (I think) and have been adapted for use on the Moon, so making them fit for the daily commute should not be too great a challenge.  A vehicle costing £5,000 with low running costs and a range of 200 km would be the car most people need, but maybe, not the car they want.  However, make a low slung version with good curves and you have a Sinclair C5 - Who said they were a bad idea?

Safety on the roads is an issue and the ability to survive a collision is important, once you have been in accident, this is not an academic concern.  Much as I love my bike, I am acutely aware of it's vulnerability and I nag my children to wear cycle helmets.  The city I live in is flirting with 20 mph speed limits, does a 20 mph environment offer the potential for lighter vehicles?

Postscript

After I finished this post, I saw an innovative electric trike, driven by a combination pedals and an electric motor fuelled by four lead acid batteries and a Mars bar.  I gave chase, but quickly lost contact before I could ask the owner's permission to take a photo.


Friday, 29 November 2013

Salad is a solar panel you can eat

Wind turbines and solar panels are energy conversion devices, their "fuel" is the weather prevailing at their location.  The terms we use to describe the weather also describe the energy we might expect to harvest with a given device.  If the sun is high in a clear sky, solar panels will work well, this will not be the case under a thick overcast sky in winter.  For wind, Munn's third law can be a useful guide, it states that "If you can wear a skirt or kilt without embarrassment, this might not be a good place for a turbine".

When I first became interested in sustainability, I wanted to understand the solar energy available in my back yard.  This involved spending a lot of time with a very small PV panel and cheap multimeter.  On a fine summer day, this was a pleasant task, less so when knee deep in December snow.  Builders working on a nearby roof questioned my sanity, as did my family, dog and friends.

In addition to rain sodden notes written with freezing fingers, there was also an observation of the obvious, that plants growth is related to the amount of energy they get from the sun.  In a conversation with an allotment holder I described a lettuce as a solar panel you could eat and he too doubted my sanity.  The relationship between solar energy and crop yield is well known to farmers.

Agriculture was the first solar energy business.  In many respects it is better model for wind and solar energy producers than the utility companies.  Seasonality is fundamental to farming.  Seeds have to be sown when the soil is warm and wet enough for them to germinate and crops are harvested  when the plants have done enough photosynthesis to produce something edible.  Storage is built into the system, for example the grain harvest takes place in late summer, the grain is then stored in silos and used at a more or less constant rate through the year.  This analogy can be extended to wind, the late summer harvest would be followed by higher winds around the autumn equinoxes which turned the wind mills to produce flower.

To try and understand the relationship between plant growth and solar energy, I started a crude experiment.  For a few weeks each Sunday afternoon, I sowed 5 ml of cress seeds in a shallow circular pot.  During the week I tried to ensure that it had a good supply of water.  At the end of each week I "harvested" the cress with a pair of scissors and weighed the result.  I chose cress because it will crop within the space of a week, whilst I made a point of eating the harvest, it is not a substantial meal and trips to the supermarket continued as normal.  The photos below show the difference in the plants after a "good" week and a "bad" week.


Whilst I was focussing on solar irradiance, I was aware that temperature was also important and that temperature is the result of irradiance.

During each week I made an estimate of the cumulative solar irradiance recieved cress and by the time I had used all my seeds, obtained this graph:
This exercise was not a model of experimental design and there were numerous sources of error, but a relationship between solar irradiance and cress yield emerged.

This work was done in 2011, since them I have become aware of solar irradiance data collected by satellites such as Ceres and made available as part of the NASA Earth Observation programme and at some point I want to rework the results using that type of data.

During this period, if the weather during the preceding week had been fine and sunny, Monday's lunch was either an egg and cress sandwich or some form of salad.


A slightly more detailed description of the experiment can be found at the end of this link:

The Solar Cress Experiment


Friday, 22 November 2013

A Brief History of Walls

Much of the housing in the area in which I live was built in the period 1870 to 1910.  Over the years gaps have appeared and the suburb has expanded to displace sheep from the surrounding farm land.  New houses have appeared on the lawns of grand houses, small orchards, market gardens and in a couple of places the side of a hill.  Whilst the style of building has changed, it is only in recent years that the method of construction has evolved.

The driving forces behind this evolution has been the Building Regulations and a change in the nature of home economics.  Prior to 2000, the general philosophy was to focus on capital costs, fuel for heating which is a major components of a home's operating costs was relatively cheap and a common way of getting a warm home after the arrival of North Sea Gas was to install lots of radiators.  This was not significantly different from the attitude of the Victorians who believed in the health benefits of ventilation and and whose homes needed a good supply of air to keep open fires burning, for them coal was relatively cheap.

Modern houses are built on a completely different principal, they have a higher capital cost but are intended to have much lower operating costs, not only that they are warmer.  The sketch below shows the difference between an old wall and a modern one.  For well over a century, the most houses were built with cavity walls which are just two single brick walls separated by an air gap and the inner wall finished with plaster.

Modern walls are significantly different, the outer layer of bricks might be similar, but the inner wall consists of a layer of foam insulation in front of blocks with good thermal properties and the finishing is insulated plasterboard.  In very rough numerical terms, old walls may have had U value greater than 2.0 watts per metre squared per degree C. whilst that of a modern wall will be less than 0.5.  In non-numerical terms you don't need much heating.  A proud owner of such a building I met recently did describe an alternative to a gas central heating boiler as a form of heating, but that may have been wishful thinking.  The sketches are not from the studying of Building Regulations, but the result of staring into building sites whilst walking my dog.

It is not only the construction of walls which has changed, but doors, windows, roofs.  Double glazing in sealed frames is now the standard and the thermal properties of these are significantly better than a single glazed sash window.

As someone interested in the concept of a "sustainable energy economy", I am sometimes puzzled by focus on energy generation.  I occasionally do a non-scientific survey of the contents of "science and environmental" sections of the media.  The stories range from the bizarre such as "Wind Turbine catches fire in Gale", "Planning permission application for new solar park", "Minister declares offshore wind farm open" and similar.  Only rarely is there an article on conservation or storage.  Its not hard to see why, few journalists or politicians can make much of a house brick, LED light or boiler controls.  Apart from a famous photo of Winston Churchill building a wall, I can't remember any interesting picture of an MP gazing lovingly at a brick.

Postscript

Shortly after I posted this, I heard a news report stating that during the prolonged winter of 2012/13 there had been 30,000 excess deaths (meaning more than normal) and that many of  these were due to old people living in cold homes.  In part, this is due to the way homes were constructed when energy was relatively cheap and plentiful.  Now that this is no longer the case, many homes, especially those of pensioners on low incomes are underheated.  Whilst I don't want to dismiss the value of retro-fitted insulation, in many cases a modest expenditure only makes the house less cold, not warm and does not cut energy bills.  Over a very long period, many thermal disasters will fall down or be demolished, but that will not do much for the generation currently living in them.  It would help if policy makers understood the problem and not ranted on about the imperfect working of the domestic energy market.


Friday, 15 November 2013

Gas Prices - A Family History

I'm peeling away 110 years of interior decorating events in our home's main bedroom. At one point, the floor and walls were dark green, which may have seemed like a good idea at the time.  The locks on the door are were installed by someone with an unhealthy interest in privacy.  Maybe because of these locks, the door was once broken down, I suspect by a jealous lover.  Below the floorboards are three generations of electrical wiring and some plumbing described by a plumbers' merchant as "old school" which may have been installed in the 1970's.  Amongst the filth are the butts of a few "Woodies" and the remains of a fag packet.  The original fireplace was broken up with the skilled use of a 4lb club hammer and the hole blocked up. After a morning of bizarre behaviour I managed to recover a hand painted tile from the debris.  The piping for the original gas lighting appears to be more or less intact, although the fittings have long since disappeared.


There is a subtle harmony in the layout of the room. The bed was positioned to make the most of the early morning sun, the coal fire would have warmed the feet.  The gas lights on either side of the bed are perfectly placed for a book at bed time.  Maybe there was once a dressing table lit by the other gas light where the lady of the house did her makeup and needlework, a hint of her perfume remains.

Electricity was present in the house when it was completed in 1901, not for use as heat or light, but for signalling.  The three main bedrooms had bell pushes which probably connected to an indicator board in what was then the kitchen.  The house is neither large nor grand, but there may have been a live-in cook and this poor woman may have had to provide room service, but she did have the warmest room in the house to work in. The lead-acid batteries which powered this system would have been charged by one of the local shops.

The bedroom illustrates the roles of electricity, gas and coal in the Edwardian energy economy.  More than a century later we use these differently.   Gas is now the principal domestic fuel and its price is increasingly becoming a cause for concern.  The graph of domestic gas price below was compiled from from a collection of family documents:
This graph spans the period from 1928 to 2013.  I am attempting to fill in the gaps, but anecdotal evidence suggests that gas prices fell slowly in real terms during the period 1950 to 2000.

The conversion from money-of-the-day to 2011-money is based on the UK government's Composite Price Index, the attraction of this scheme being the availability of a long time series (one version extends back to 1750).

At the start of the 20th Century, gas was mainly used for lighting.  Coal was the principal domestic fuel for cooking and burning in open fires. The gas came from gas works, often located close to town centres and near a railway line. The economy of gas works was based on a combination of the sale of gas for lighting and coke for heating. By the 1920's gas stoves were rapidly replacing solid fuel ranges.  Simultaneously electricity was displacing gas as the energy source for lighting. Electricity was a much more versatile fuel than gas, it could be used for cooking, lighting, appliances and heating.  The relatively high cost of electricity limited the popularity of electric fires. By 1939, many houses were using electricity for lighting and appliances, gas for cooking and coal or coke for heating.

During the war years, domestic energy consumption declined. Coal was often difficult to obtain, the blackout discouraged the use of lighting and many men and women were away from home either working in the factories, on the land or serving in the forces.  After the war, the availability of energy for domestic consumption increased as war production ceased and the lights were turned on again and houses became warmer.

 In the 1950s, electricity was produced in increasingly larger power stations and distributed by a national grid. Gas was still produced and distributed locally, it was not until large volumes of natural gas were discovered in the Southern North Sea that a national gas distribution network was established.  The North Sea reserves stimulated a "dash-for-gas" and the role of gas in the energy economy changed significantly.

 By 1980 gas had more or less displaced coal as a domestic fuel. This transition was driven by a combination of low cost and convenience.  Anecdotal evidence suggests that domestic heating costs dropped with North Sea gas but there were two other driving forces.  Not least was the ease of  use. Whilst the occasional coal fire is pleasant, heating a house with coal is a labour intensive process requiring coal to be carried, grates to be cleaned and ash to be dumped. Also, for many years fog and smog in urban areas had been a public health problem and the advent of smokeless zones in towns discouraged the burning of coal.

The availability of low cost gas lead to its increased use as fuel for electricity generation.  By the beginning of the 20th century, the UK was ceasing to be self-sufficient in natural gas and imports either by pipeline from Europe or as LNG from the Arabian Gulf and elsewhere have been increasing.  The result of this is that the gas price is now set by international markets.

Friday, 8 November 2013

Soil Temperatures - Update

This is an update of a post published on 02-Aug-2013 which describes the hole in the ground used to collect soil temperatures.  I now have just over a little more than one year's data which makes it possible to look for patterns in the data and do a year-on-year comparison.  I started this project in August 2012 just as the ground was starting to cool after the summer.  The full data set is shown below:
The same general patter is present in the Autumn of 2013 as it was in 2012 with the topsoil cooling more quickly than the sub soil.  The maximum values of topsoil temperature were observed in July when there were several weeks of clear sky when the Sun was high in the sky.  The lows were towards then end of long winter when it was April before Earth and Englishman felt warm in the garden.
So far, weather at the end of Autumn has been milder than in 2012 and the subsoil temperatures are two to three degrees higher than last year.  The topsoil more or less follows the air temperature but, it's variation is increased by radiative heating and cooling can lead to loss or moisture and frost respectively.
The observations from the last month illustrate the complexity of the heating and cooling processes.  During the weekend of 13-Oct,  average air temperatures had fallen to below 10 deg. C (cold air from mainland Europe?) and the topsoil temperature fell below that of the subsoil.  A week later, average air temperature rose to more than 15 degrees (warm air from the Atlantic?) and the situation was reversed, the topsoil was warmer than the subsoil.  In addition to air movements (note to self, try and look at a weather map each day and see what's happening), there would also have been radiative cooling and heating.

After a year, the ritual of poking a wire down a hole in the back yard at dusk on Sundays is well established, data on this web page is periodically updated:

Brighton Webs - Soil Temperature

Friday, 25 October 2013

Energy Storage and Vegas Values

Energy storage is the buffer between supply and demand.  Wind and solar sources are weather dependent systems whilst home and work life tends to follow a more or less predictable routine.  Whilst the ancient mariner or miller might have taken a duvet day when the wind was not blowing, the office worker is expected to be at his/her desk when the weather outside is fair or foul.  Storage is a key component in renewable energy systems.

Monte Carlo simulation is one way to explore the interaction between supply, demand and storage.  The concept is simple, you throw random events as a mathematical model and see how it behaves, whilst this may sound abstract, its more than a bit like real life.  The name was comes from the roulette wheels in the casinos of Monte Carlo in the 19th century, in a fair and decent world, these devices are true random number generators.  If the technique was being named today, it might be called Vegas Values.

The example is based on a simplistic model of a system with three components, a small wind turbine, battery storage and a load. The example has been set up such that the average supply and demand are both 1 kwh.day, however, the distribution of  the supply and demand are different, and it is probable that on any given day, supply and demand will not balance. There could be large demand for energy on a calm day or little demand on a windy one. The inclusion of storage in the form of a battery helps match supply and demand. In this example, we want to understand the effect on system reliability for different amounts of storage.


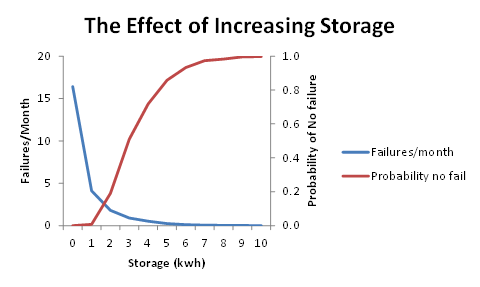
Over a given 30 day month, the wind turbine produces an average of 1 kwh/day, this supply is assumed to be a triangular distribution with a minimum of 0, a  mode of 0.5 and maximum of 2.5 kwh. This supplies a 100% efficient battery, the capacity of which subject of the simulation. The model was run with storage capacities ranging from zero (no storage) to 10 kwh. The load is also 1 kwh/day and also modelled as a triangular distribution, the minimum, mode and maximum values are 0.5,1.0 and 1.5 respectively. The system "fails"; when the battery cannot supply the load. The parameter of interest is the number of days per month the system fails, which can also be expressed at the probability of the system not failing during the month.

The core of the model is shown in the flow chart:


This is a very simplistic model, so a single function is used to return a triangularly distributed random number, the arguments being the minimum, mode and maximum values. The Python code for this simulation can be found on our website. The principal variable is "storagesize" which is the capacity of the battery in kwh. The output of the program was used to create the graph below.

This simplistic model of a hypothetical system suggests that increasing storage reduces the probability of system failure but at the amount of storage increases, the law of diminishing returns set in.

Related Material

Monte Carlo Simulation

Triangular Distribution

Saturday, 12 October 2013

The Clear Sky

The starting point was a statement of the obvious.  Clouds affect the performance of solar energy systems and this can be summarised as "clear sky, good"  and "overcast sky: bad".  The problem was how to quantify this, a convenient descriptor is something that might be called the clear sky factor (reduced to CSF) which is defined as:
For this concept to be useful it is necessary to have a definition and an estimate of the clear sky irradiance.  There are well developed models which can provide good estimates of clear sky irradiance, but they require some knowledge of the state of the atmosphere, whilst such data is provided by satellites such as Ceres and weather balloons, it can be hard to relate this data to a casual observation.  Another approach is to use a correlation for a given location, a good example of this is the work the Meinels in the Mojave Desert in the 1960s.

Comment

This is a discussion of work in progress and is a development of a previous post on the diffuse fraction and should be treated with similar caution.

Correlation

The Meinel's formula produces an estimate of direct normal irradiance for a given value of air mass:


The solar constant is approximately 1370 watts/m2, it varies during the year due to the elliptical nature of the Earth's orbit around the Sun.  The form of the equation is well suited to its application and whilst I was defeated in an attempt to work out the least squares equation, it is possible work with it using the Solver add-in for MS Excel.

I had found that a crude piece of equipment (described in the post on diffuse fraction) can provide an insight into the way irradiance changes with the state of the sky.  I became curious to know if the data collected by this device could be used to provide a correlation in the form of the Meinel formula which reflects the local climate and possibly produce an estimate of diffuse irradiance.


Clear skies are rare in England, out of approximately 100 observations, only a few were taken under a completely cloudless sky.  Typically the day will start clear, but by noon, some clouds will have formed.  Whilst the equipment is simple, the method of operation does ensure you observe the sky and this provides partial compensation for the lack of sophistication.

First Attempt

The equipment provides an estimate of global horizontal and diffuse horizontal irradiance and if the time of the observation is recorded correctly, the zenith angle can be calculated from Sun-Earth geometry and this in turn can be used to calculate the plane parallel air mass.  A combination of these bits of information provides an estimate of the direct normal irradiance:


A plot of the result to date is shown below:

The graph shows two things, the first is wide spread in the range of values for DNI for a given air mass.  Most of the low values were observed when there was some cloud present in the sky, even though the sky was clear in the direction of the Sun, quite often whilst the sky appeared to be clear, satellite images suggest that there was some cirrus present within a few kilometres.  A secondary objective was to compare my description of the sky with those from metar reports from a nearby airfield, in general, there was reasonable agreement on the extent of cover (I do not attempt to estimate height).  Many airfields only report low level cloud because that has the greatest influence on aircraft movements, thus a report which suggests a clear sky does not take into account any high level cloud which has the effect of increasing diffuse irradiance and increasing the diffuse fraction.  Secondly, the upper limits of direct normal irradiance with low values of diffuse fraction were close to the values predicted by the Meinel formula.  As the diffuse fraction increases with air mass, some selection of data points, possibly using satellite images as a guide, might yield some clear sky data points at high air masses.

At the time of writing, there is not enough data to attempt a correlation, but the work to date suggests that one may be possible.

Diffuse Fraction

Whist making these observations is pleasant task involving walking or cycling in the sunshine, it can be frustrating when the data yield is small, especially at the start or end of the day. The graph below shows the temperature, dew point, diffuse fraction and sky state for the 01-May of this year.


Around nine, in the morning, the sky appeared to be hazy, but clear, as the morning progressed a few small cumulus clouds passed across the sky, it was only around noon, that the sky was "clear".