Pages

Friday, 16 August 2013

Urban Wind

Munn's third law states that any place you can wear a kilt or a skirt without embarrassment might not be a great place to put a wind turbine.  With this in mind, I spent a few mornings cycling round a seaside town with a simple wind speed meter in an attempt to get an understanding of urban wind.

Until recently the most common source of wind speed data was weather reports from airfields. These are large open spaces and the weather station is usually located somewhere close to the point of touchdown where its data will make the greatest contribution to aircraft safety.  This is in contrast to most residential and commercial areas which are cluttered with buildings, trees and infrastructure such a bridges all of which might be crammed into hillsides and valleys. In the past few years, data from small weather stations mounted in backyards has become available.  The two sources give different impressions, typically, airfields have a average annual wind speed in roughly in the range 4 - 7 m/s, whilst backyards might experience 1 - 4 m/s.  As with all gross generalisations, there are exceptions, but my own backyard sitting on the sheltered side probably has an average of around 1 m/s based on many calm days and a few gusty ones.

Wind speed measurements are typically taken at a standard height of 10m although there are some important exceptions, for offshore buoys it is often 4 - 5 m, for offshore platforms it can be well over 100m (to assist helicopter operations).  Private weather stations can be at any height available to the owner. However, they are generally located at the base of the boundary layer which is not an ideal place to put a wind turbine.  Utility scale machines are mounted on towers, typically 100 metre tall which lift the rotor out of the turbulent and complex air flows found around roof and tree tops.  The photo shows a medium sized wind turbine mounted on a tall tower in an urban location:


However, this type of structure is not practical/acceptable in the average backyard, so wind found at approximately 10 metres is the the resource that is available to most people (subject to neighbours, town planning and building regulations which keep towns and cities safe and relations between residents harmonious).

The plan was to cycle around the town taking wind speed measurements at a variety of locations and compare them to data from a small airfield a few km to the west.  In a failed attempt to introduce an element of street theatre I took a small model of a Savonius wind turbine with me.


Whatever other merits it may possess, the Savonius design can withstand the rough handling that comes from being strapped to the back of a bike.

During seven outings I found about 20 locations where I could take measurements.  With the single exception of a curious dog, this bizarre activity attracted no attention.  The locations included the seafront and a breakwater, the roofs of multi-story car parks and my own backyard.  One days results are shown in graphic form below:

Moderate winds at the airfield are usually smooth and there is a good relationship between the wind there and that experienced on the sea front.  In these places the Savonius model would spin continuously when the wind was greater than 3 m/s.  However, in the town, suburbs and parks the wind was usually attenuated and turbulent, the graphic is a sketch of the relationship between "clear" and "urban" wind:

The rooves of car parks were the most interesting, all five locations were well above surrounding roof tops, yet in all cases, the wind was turbulent and it was rare for the Savonius model to spin continuously.  Having seen several horizontal axis wind turbines in urban locations they often appear to "hunt" for the wind then spin up and down with the gusts.  The vertical axis Savonius was usually quick to respond to gusts, however, the coefficient of performance is low.  The coefficient of performance is the fraction of the wind's energy that the turbine manages to extract.

The relationship between wind speed and power is cubic, thus a 5 m/s wind has almost five times the energy of one of 3 m/s, the relationship is complicated by variations in a turbine's coefficient to performance with wind speed.  In general, the coefficient of performance declines with increasing turbulence.

It is probable that a suburban area with low and widely spaced housing on flat land might give more encouraging results, but in a densely populated English town, small wind turbines have limited potential for generating significant amounts of energy.  The greatest potential for wind energy appears to be large turbines located offshore where average annual wind speeds are significantly higher than those onshore.  However, offshore wind is still a weather/climate dependent energy source.


Friday, 9 August 2013

Negawatts vs, Megawatts

There are two ways to reduce emissions and increase energy  security.  The first is to use less energy and the second is to generate it from renewable sources.  The two approaches are not mutually exclusive and both are desirable but they compete for resources.  Around 2006, I became interested in renewable energy, up to that point, I had not thought too much about consumption and at that time electricity was reasonably priced.  Typical grid-tied, rooftop PV installations produce between 1,500 and 2,500 kwh/year.  A good starting point was to try reduce our consumption to the level at which a form of self-sufficiency could be attained.

Alongside my interest in renewable energy, is a belief that investments which are good for the environment, should also be good for me.  Added to this is the belief that sound investments are based on fundamentals (e.g. fuel savings) and should not be driven by tax regimes or subsidies, In other words, I'm prepared to buy an item which reduces my emissions, but I want to be rewarded in the form of lower energy bills.  For energy consumption, and therefore emissions to fall, there should be a "virtuous circle" by which I use less energy and I am better off as a result.  This should be possible to achieve, energy is now expensive.

Whilst I am fascinated by solar devices and wind turbines, conservation was consistent with my opinions (my favourite coffee mug has the slogan - "everyone's entitled to my opinions").  The graph below shows our household's estimated electricity consumption since 2005:


When we started there were some quick wins, incandescent lamps were replaced by CFLs and old computers which were better room heaters than number crunchers were replaced by laptops.  The gas driven domestic hot water system was an economic mess consisting of a gravity feed system with an efficiency of 20% (a charitable estimate).  This took an average to two hours to create a warm bath, therefore anyone needing to be clean used the immersion heater (cheap at night, but expensive during the day).  The water heating was upgraded to a pumped system which also reduced the gas bill and did not leak.  Rough estimates of the breakdown of consumption "before" and "after" are shown below.


Since 2007, consumption has drifted down to an average of 6 kwh/day, mainly as a result of taking account of energy efficiency as things like fridge have had to be replaced and just being aware of our energy consumption.  We are not wandering around in Stygian darkness obsessed by energy bill dropping through the letterbox.

The law of diminishing returns is beginning to assert itself, we are starting to replace CFL lamps with LED ones which may take us down to 4 kwh/day over the next one or two years.  Our electricity consumption will probably be in the range 1,000 to 1,500 kwh/year, which compares well with the national average of around 3,500 kwh/year (comparing averages is always dangerous).

It has to be said that a wind turbine in the back yard would be fun but as I have embarrassed myself on countless occasions by wandering around the garden with a wind speed meter consistently reading 0 m/s and have no desire to annoy my neighbors, this is not going to happen.  The sun does not shine at night and rarely during winter, so rooftop PV does not appeal.  So, I will press on with the LED lights.

Sadly, conservation is not sexy.  Acquaintances with rooftop PV who have seen me cycling around with a model wind turbine strapped to my back ask me why my south facing roof is empty and an unscientific survey of the environmental pages of the papers (read on my phone) suggests that greater coverage is given to wind farms than to things lurking in cupboards like boilers, heating controls and meters.  A knowledge of the capabilities of smartphones is a sign of virility whilst being able to read gas and electricity meters is considered boring.  Typically, a mobile phone bill is in the range £15 - £30/month, whilst energy bills often exceed £100/month, so there is an incentive to take an interest.

The scale of investment is also an issue, I have the occasional outing to an "eco" fair where a high proportion of the offerings are green boxes with a price tags well over £1,000.  This is not the sort of money that fits well into a typical family budget, yet £10 for an LED light or a few quid extra for a more efficient fridge or washing machine can make a difference over time.

Policies which focus on conservation are difficult for politicians, offering subsidies for generation projects gives an incentive to do something.  Telling people not to do something, i.e. use energy is creates a range of reactions ranging from indifference to to charges of infringing of civil liberties:.


Its better to make a good case for energy efficient lighting than embarking on legislation which does not win hearts and minds.  Had we not adopted CFL's are electricity bill would now be approaching £100/month.

The link between environmental benefits and high cost objects also seems to be well established in (some) political thought processes.  During the 2010 election I was accosted by a canvasser keen to establish the environmental credentials of their chosen candidate, in the interests of fairness, it is probable that I was being a pain at the time, but the patter went along the lines "Of course she can't afford a Hybrid Car". My understanding of hybrid vehicles is that by combining a petrol/diesel engine, motor/generator and a battery you can make a fairly efficient vehicle for £27,000, however, some conventional vehicles, often described as "dull" by reviewers, offer similar performance for much less.  Other options include a small car, no car and a bicycle.  If you live in a remote rural area, you need a car, if you live in a city, a bicycle makes sense economically and environmentally, that also seems to be the view of the current Mayor of London, the man behind the Boris Bike.

Next week - Urban Wind


Friday, 2 August 2013

Soil Temperature

Last year, I became curious to know why there was such a wide variation in the time to germination of seeds (mainly beetroot).  Sowing things at the earliest date suggested by the directions on the packet seemed like a good way to maximise yields, however, some seeds took a month to germinate with a low success rate, whilst the same variety planted in late July germinated quickly with a high success rate.  One explanation was variation in soil temperature, even in England, the ground is warmer in July than it is in March.  To try and understand what was happening, I started measuring soil temperatures approximately an hour before sunset on Sunday evenings.  This post is a celebration of a year's data collection and the politeness of my neighbours.

This web page is periodically updated with data as it becomes available:

Brighton Webs - Soil Temperature

The first step was to sink a length of copper pipe into the ground, the only consideration about its location was the hope that the house's water supply was located somewhere else.  The base of the pipe extends a few centimetres into the chalk which is the dominant feature of the landscape in these parts.


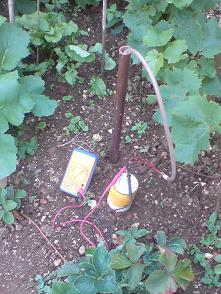
Temperature measurements are taken by lowering a 4.7k thermistor mounted on the end of a 2 metre length of neoprene tubing.  A baffle on the end of the tube is meant to limit the movement of air in the hole to ensure that the measurement is related to the pipe, not the air within it.  The resistance of the thermistor is taken with a basic and much abused multimeter.


The photo shows the equipment in use, data logging is done with a pencil and paper.

The results to date are plotted on the graph below together with the average air temperature for Brighton.

The graph clearly shows the wide variations in temperature experienced by the topsoil.  In winter radiative cooling on a clear night can take the topsoil temperature several degrees below the air temperature whilst a hot sunny day with a clear sky can raise it several degrees above it.  The thermal environment of vegetables is much more turbulent than one would suppose from simply looking at the air temperature from a weather report.  Some gardeners will have experienced the damage done by overnight frost and discovered this on a warm spring morning.

In contrast to the topsoil, the subsoil temperature closely follows the average air temperature.  The relationship between the topsoil and subsoil temperatures is interesting, when the ground is cooling after the Summer Solstice, the subsoil is warmer than the topsoil.  After the winter solstice, the subsoil takes a few weeks to start warming.  It is as though the subsoil is acting like a storage heater, keeping the soil warm as Autumn and Winter approach.  I was intrigued by this, the graph below shows a simulation of the solar irradiance received by the earth's surface and the average air temperature.  Solar irradiance peaks at the Summer Solstice in June and is at a minimum at the Winter Solstice in December, yet the warmest month is July and the coldest one is January
Whilst solar insolation and radiative cooling account for a large part of the temperature variation experienced by the topsoil, advection is also significant.  From January to April 2012, cold air masses moved across the Channel from Continental Europe, these acted to suppress the soil temperate, making it difficult for seeds to germinate, it was May before the topsoil temperature got above 10 deg. C.

Climate classification schemes as Koppen are based on the concept that native plants have adapted to the prevailing temperature and rainfall.  In 1954 Dorothy Hartley published "Food in England", this was before the worldwide movement of fruit and vegetables.  In the 1950s, market gardens could found on the edges of big town, also many people had been involved in part time vegetable cultivation during the war and had continued to do so in their back gardens.  Some of the varieties described by Harley had been bought to England form overseas, the best known example being the potato which is thought to have originated some around Peru or Bolivia, but all of them had been grown here for at least a hundred years.  A common characteristic of most of the plants grown from seed is that they will germinate in temperatures of less than 10 deg. C..

Friday, 26 July 2013

LED Lighting

My first experience of LED lighting was in 2009 when I used a 12 volt 1.5 watt lamp as part of a very small solar powered system.  This device consisted of a cluster of conventional white LEDs, whilst it was not a solution to lighting the home, it was used in the garden where it was suspended over a table so we could see what we were eating (and drinking).  For a very small input of energy, we were saved from our son's early attempts at barbecuing and filled in the time by reading a newspaper.

I've been aware of LED lighting as an emerging technology, so in 2012 a purchased a 7 watt unit which whilst being similar in appearance to an incandescent lamp, consisted of a light emitting surface and a not very effective diffuser.  Sadly this did not win the hearts and minds of my family, however, it is now mounted in a standard lamp and directed upwards at a white ceiling, provides a pleasant ambient lighting effect with limited impact on the electricity bill.

At this point, it seemed that LED lighting would work well where only direct lighting was required, for example in a desk lamp.  So early in 2013 I invested £5 in a 3 watt "spot" lamp which works very well.  My working area is now lit with 10 watts of LED lighting.


Over a seven year period, the energy used to light my work space has dropped from the 200 watts used by incandescent lamps in 2005 to around 10 watts with LED devices in 2013.

Ever since the days of gas mantles and oil lamps, most homes have been illuminated with a combination of direct and diffuse lighting.  With the advent of electric incandescent lamps, the most common lighting scheme was a single 60 or 100 watt lamp hanging from the ceiling, if you were posh there might be a couple of wall lights with candle shaped bulbs and readers of "Homes and Gardens" had standard lamps with lace shades, known to some as "tart's knickers".


Until recently, there has not been readily available LED lamp with the geometry to provide a point source of light with enough output to bounce off walls and ceilings.  However, I have just purchased a 3.5 watt LED which has an output of 230 lumens which is capable of replacing some 10 - 18 watt CFLs.  More importantly, my wife thinks this is a good idea.

Over the next few months we will experiment with LEDs around the house.  I guess we may have to add some more fittings and make some adjustments to completely replace CFLs.  This will allow the steady reduction in our electricity consumption to continue.  Whilst I'm interested in energy conservation, I won't/can't make massive capital outlays, however LED lighting does not require this and equally important pays back in between three months and three years.  This makes economic sense.

Over the past few years our electricity consumption has steadily fallen from more than 20 kwh/day to maybe less than 5 kwh/day.  This has been achieved by doing little more than taking account of energy consumption as household items have had to be replaced and a general awareness resulting from reading the meters occasionally so that we are aware of what we are consuming.  I hope that I appear normal and not obsessive.

This has lead me to the opinion that much energy policy is based on supporting high priced capital items such as roof-top PV (feed-in tariffs) and ground source heat pumps (renewable heat incentive).  Whilst I accept that there might be some merit in these schemes, they only appeal to people with surplus cash resources who are not a large part of the population.  They also act to create a perception that energy sustainability is expensive, whilst if done properly can reduce energy costs.  My current view is that low cost technologies which can be adopted by a large proportion of the population should have a higher priority.  I suggest that LED lighting, energy meters placed in the kitchen which display the current energy bill as well as the amount of energy being consumed and zoned heating would significantly lower domestic energy consumption.

The business model used by energy companies is also part of the problem, at 25 kwh/day I am a good customer, at 3 kwh/day I'm less attractive and possibly a nuisance, yet the economy as a whole needs viable energy suppliers, that problem requires a better mind than mine.

Blogger's Note

It's sometimes fun to take an argument to its illogical conclusion.  I sometimes read small chunks of The Guardian on my phone around 05:00 in the morning when it is still dark, to avoid waking my wife I don't turn on the bedside light.  Whilst a liberal press can guide my mind, I do have to turn on a light to find my way to the lavatory safely, thus it is unlikely that smartphones will replace domestic lighting.


Friday, 5 July 2013

Buckets are not only for beer

At university during one of the oil price shocks we were sent off to investigate the potential of chicken poo as an energy source, with hindsight, I now realise that this was just a subtle marking scheme.  In the first years of the 21st century we were going to save the planet by strapping wind turbines to our chimney pots.  Despite the general tone of this blog I support the concept of a sustainable energy economy, but building one is a big, big challenge.  As I stare out of the window, I can neither smell chickens or see a wind turbine, but there may be some rooftop PV lurking in the shadows.

Wind and solar installations are energy conversion systems, for example wind turbines take something that blows your hat down the street and turns it into electricity which you can use to light your home.  Baz Luhrmann has remarked on sunscreen.  Whilst you can learn much about wind and solar energy by staring at maps and graphs, messing with models and prototypes is also instructive and much more fun and this was where the Solar Bucket started around 2007.

The Solar Bucket, so called, because for a short time some of the bits were located in a bucket before being moved to a large sandwich box.  The concept was simple, a 4.7 watt solar panel charged a 3.2 AH lead acid battery during the day, overnight the energy stored in the battery was used to power something.  Initially, the something was a couple of 10 watt resistors, whilst these provided a steady load, they were a bit boring, so after a few months an old computer case fan was installed.  This was a bit more entertaining, but failed to grab the interest of either my family or neighbours, the breakthrough came with a 12 volt LED light which was bright enough to read a newspaper and more appropriate to my family, light the outdoor dinner table so that we could see what we were eating.  The energy yield was determined by giving the battery an hour to stabilize at dawn and dusk and then measuring the voltage, the battery having been previously calibrated.

A more detailed description can be found here:

The Solar Bucket

This page also contains links to results and discussion.

Compared with virtually anything found in a school lab, this was a crude bit of equipment, but over the period 2008/2009 generated enough data to produce this.

Underlying this graph is a learning curve and in particular how to manage the battery.  The battery was much too small and probably suffered damage from overcharging during the summer months, only later did I learn enough about power electronics to give the battery some protection and also a bigger battery would have helped.

Whilst undeniably crude, this experiment taught me some useful lessons.  Close to the top of the list is the challenge of seasonality.  We're 50 degrees north of the equator, so the sun is low in the sky in winter and often hiding behind cloud, so unless a solar energy system is going to be stupidly large you are not going to get through winter without either a backup or a complementary technology, such as a wind turbine.  Next, was the importance of energy management, the LED light worked because it was efficient and was able to use the energy in the form which it was available , i.e. 12 volts DC.  Whilst its possible to provide a range of low DC voltages with reasonable efficiency, there are higher losses associated with moving to 240 volts AC which is what many domestic devices expect.  Most important is the opinion that storage is the missing link in the sustainable energy economy, this is especially true for solar energy systems because the Sun does not shine at night and some summer days can be a bit dreary also the demand for power rarely matches the supply.

A couple of pictures show the reality:


This is my favourite picture of the Solar Bucket.  The panel was easily restored to functionality with a yard broom but without this simple maintenance the energy yield would be zero on a snowy day.  Bird poo also made a return visit to renewable energy.


This is the computer case fan, the blue LED's gave a frisson of excitement to task which often involved standing in the rain.

I recommend this experiment to politicians and policy makers.


Friday, 28 June 2013

Location, Location and Location

When I became interested in sustainable energy systems, I wanted to understand the nature of wind as an energy source.  An early step was to create wind speed distribution diagrams for several hundred locations around the world taking data from a wide variety of sources such as aerodromes, weather ships, offshore buoys, radiosondes and small weather stations located in backyards.  The principal conclusion from this exercise was the wide variation in both average wind speed and its distribution.


This post is based on my own research and has not been reviewed  by anyone else, thus it should be treated with caution as there may be other and more appropriate interpretations of the same data.  Another caveat is that much wind data is collected at a standard height of 10m in open terrain to assist ground operations.  Thus the bulk of readily available data describes air flow at the base of the boundary layer but the ideal location for wind turbines is as far above this zone as possible.  There may also be gross generalizations.

The variation of wind speed with location is apparent in daily life.  In the coastal town where I live, the wind maybe blowing smoothly at 10 m/s on the seafront whilst in the town it will eddy around buildings appearing as long period gusts struggling to make 8 m/s even on the roof of a multi story car park and in residential areas away from the sea, there may even be still or light air.  For a brief period in my youth, I was a merchant seaman and had ample opportunity to study wind and waves during lookout duty, still air was rare, usually there was a steady breeze with accompanying waves gave the the ship varying amounts of motion.  In winter, gales with speeds of more than 20 m/s had an energy seldom seen onshore.  The energy of wind is proportional to the cube of its speed, thus, a steady stream of air with a velocity of 10 m/s has eight times more energy than one with a speed of 5 m/s, hence the destructive nature of storms where the wind speed exceeds 25 m/s.

The average wind speed over Western Europe at a height of approximately 800m is typically in the range 10 - 12 m/s, this increases to the north and decreases to the east.  At this altitude the influence of terrain and surface cover is small and whilst there are variations, it is reasonable to assume that this is close to the top of the planetary boundary layer over low lying ground.  Wind speeds at this altitude are measured by weather balloons.  The variation at the surface is much greater.  On mountain tops, the average speed can be similar to that observed by weather balloons, at the other extreme are sheltered urban locations where the average speed maybe less than 2.5 m/s which is far too low for the economic operation of wind turbines.  In open inland locations the average speed might be 5 m/s, whilst on a downland ridge it might rise to 6 m/s.  A few miles offshore, the range could be 6 - 9 m/s.  From the work done to date, there is an inference that average onshore wind speed decreases with increasing distance from the coast, but no obvious correlation has been obtained.

This work suggests that, from an energy harvesting perspective, coastal and offshore locations offer significant advantages resulting from higher and smoother wind flow.  Against, these must be set the higher costs of offshore operation and construction.  Most offshore wind farms are located in shallow water with the turbines mounted on a single pile, but there is growing interest in floating support structures such as the semi-submersible platform.


The attraction of semi-submersible platforms is that they minimize the motion caused by waves which is the reason they are extensively used by the offshore oil and gas industry drilling operations.  They are also economically attractive for two reasons.  Firstly the installation cost is largely independent of water depth and secondly because the construction  can be completed at the building yard before the completed unit is towed to the installation site.


Friday, 21 June 2013

Don't talk about.........

I do not know how accurate this graph is, it was literally done on the back of an envelope with a few photocopies of some government statistics around 2007 when I had a period of enforced idleness.  For all practical purposes, it is a statement of the obvious i.e. the higher your level of income, the greater your level of CO2 emissions.


The graph leads to two observations, the first is that the lower the household income, the greater the proportion spent on energy, which has resulted in policies such as the pensioner's winter fuel supplement.  The second is a little more subtle, that as household income increases, the weaker the link between energy consumption and energy price.

Energy sustainability is based on three elements, emission free generation and energy management, sometimes called conservation.  Despite strong opinions for and against, wind farms, rooftop PV and similar concepts are openly discussed in both the media and pubs.  However, conservation is a difficult subject.

A few years back, legislation was introduced restricting the sale and use of incandescent light bulbs.  Back in 2005, most houses were lit with a mix of 60 and 100 watt incandescent light bulbs, Today, most homes that let me through the front door appear to have adopted 10 - 20 watt CFLs.  When the legislation was introduced, I remember some shops selling incandescent light bulbs presenting themselves as champions of civil liberty.  In our case, had we not made the switch from incandescent to CFL, our electricity bill would be more than £100/month.  The bottom line of this paragraph is that if an energy management technology makes some economic sense, it will be adopted.

It is when the discussion moves to cars, that passions are really aroused.  This is illustrated by a couple of song titles "Little Red Corvette" by Prince and the Beach Boys "Fun, fun, fun" which has the line "Til her daddy takes the t-bird away", don't we all want to be part of the story.  There may be a generational difference, mine tended to lust after things like Frog-eyed Sprites whilst the current one favours large SUVs and Pick-up trucks, I appreciate that this observation may not stand up to scrutiny.  Due to dodgy eyesight, I rarely drive and use a bicycle for short trips and public transport for longer ones, prior to making this move, I was as attached to my car as the next guy, but it has been a liberating experience, around town the bike is quicker and cheaper and I can read the news on my smartphone when travelling on buses and trains.  It is clear that cycling is increasing in popularity, but the perceived independence, status and level of control bestowed by being behind the wheel of a car maintain a strong grip on society as a whole.  Making the case that the car brings mixed blessings, except to fellow cyclists, is not a good opening line at parties.

It is hard to make conservation attractive and even harder for high income groups, the link economics (e.g. CFL's versus incandescent light bulbs)  and greater functionality (e.g. bike versus car in urban environments) is often perceived as a reduction in status and self-denial neither of which are much fun.